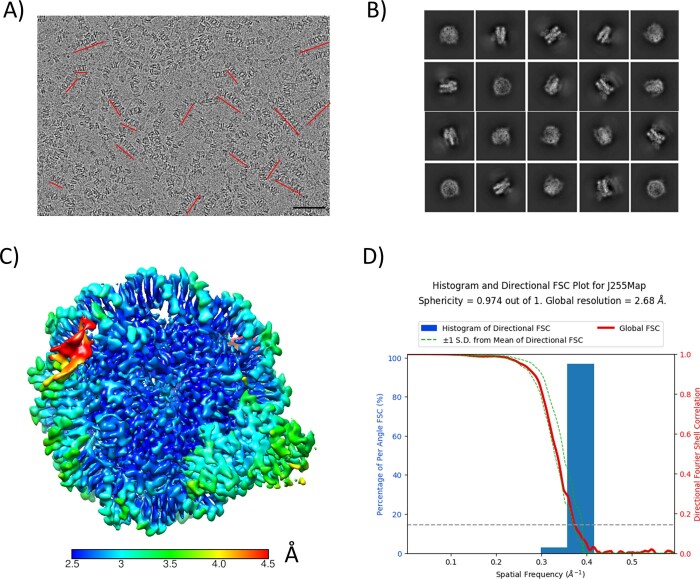
Extended Data Fig. 1. CryoEM analysis of CENP-N in complex with CENP-A mono-nucleosomes (reconstituted with 147 bp palindromic α satellite DNA).
a) Raw cryoEM micrograph. Stacks are indicated by red lines. Size bar is 50 nm. b) 2D classifications of particles at the mono-nucleosome level. c) Local resolution of the 3D map for CENP-N in complex with CENP-A mono-nucleosomes. The color key indicates the resolution. d) 3DFSC analysis of reconstructed 3D map.

