
Figure 2: Mesmer delivers accurate nuclear and whole-cell segmentation in multiplexed images of tissues.
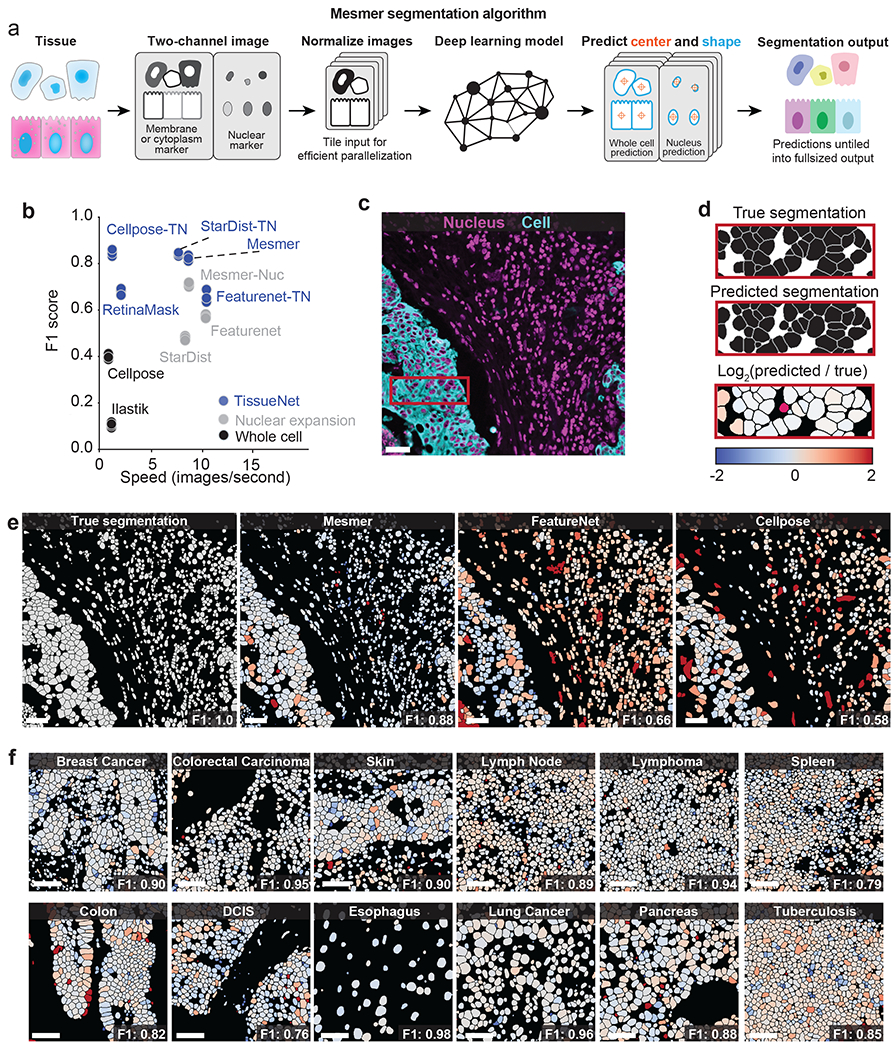
a, Diagram illustrating the key steps in the Mesmer segmentation pipeline. b, Speed versus accuracy comparison of Mesmer and previously published models, as well as architectures we retrained on TissueNet. Accuracy is measured by the F1 score (Methods) between the predicted segmentations and the ground-truth labels in the test set of TissueNet, where 0 indicates no agreement and 1 indicates perfect agreement. c, Color overlay of representative image of colorectal carcinoma. d, Inset showing the ground truth (top) and predicted (middle) labels from a small region in c, along with a visual representation of segmentation accuracy (bottom). Predicted segmentations for each cell are colored by the log2 of the ratio between the predicted area and ground-truth area. Predicted cells that are too large are red, while predicted cells that are too small are blue. e, Ground-truth segmentation labels for the image in c, along with the predicted labels from Mesmer and previously published models, each colored by the log2 as in d. As seen visually, Mesmer offers substantially better performance than previous methods. f, Mesmer generalizes across tissue types, imaging platforms, and disease states. The F1 score is given for each image. In all panels, scale bars are 50 μm.