
Figure 4: Mesmer enables accurate analysis of multiplex imaging data.
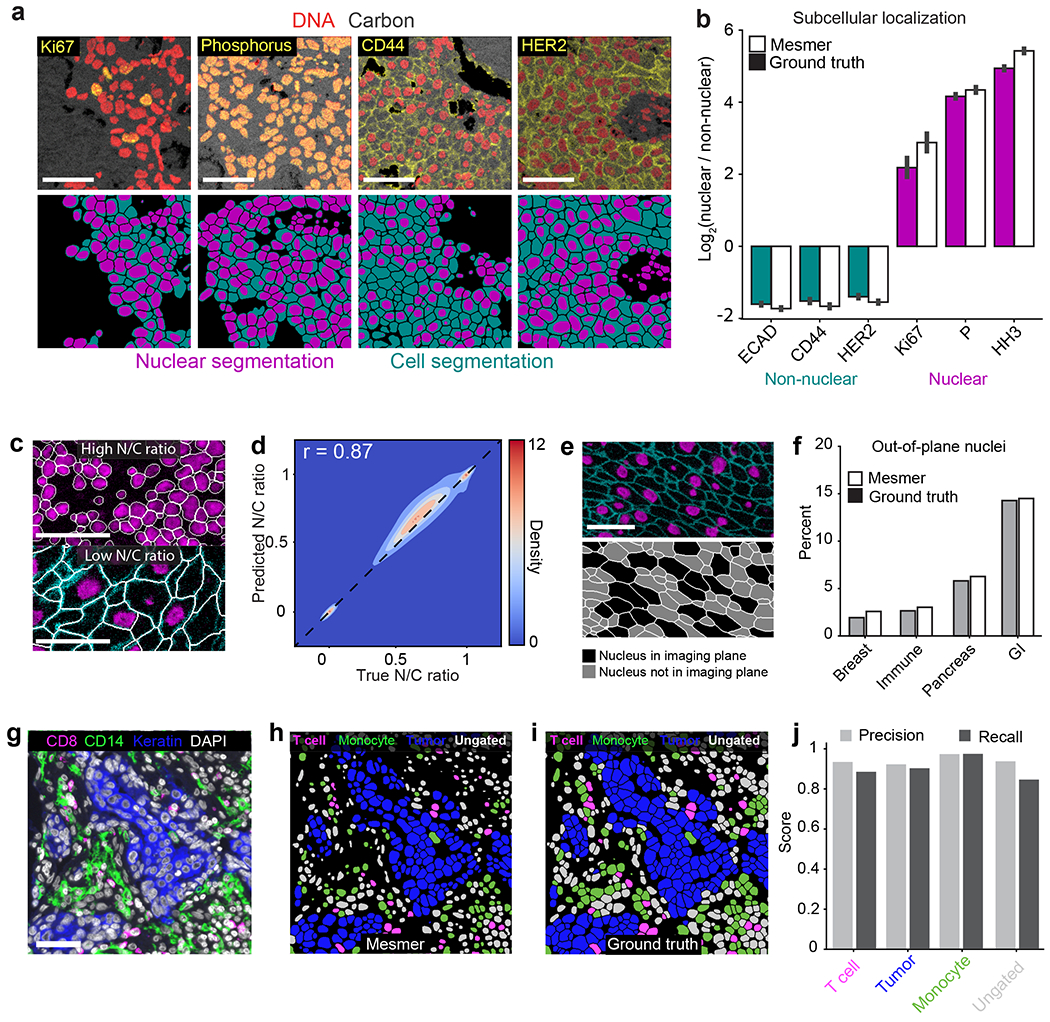
a, Color overlays showing staining patterns for nuclear and non-nuclear proteins (top), with associated nuclear and whole-cell segmentation predictions (bottom). b, Quantification of subcellular localization of the proteins in a for predicted and ground-truth segmentations. The agreement between localization for prediction and ground-truth segmentations indicates that Mesmer accurately quantifies protein localization patterns at the single-cell level. n=1069 cells. Data are presented as mean +/− 95% confidence interval. c, Example image of a tissue with a high N/C ratio (top) and a low N/C ratio (bottom). The N/C ratio is one of several metrics used for quantifying cell morphology (Methods). d, A Pearson’s correlation contour plot of the accuracy of N/C ratio predictions across the entire test split of TissueNet demonstrates that Mesmer accurately quantifies cell morphology. e, Representative image of a tissue with many nuclei outside the imaging plane (top), along with corresponding segmentations colored by whether the nucleus is or is not in the imaging plane. f, Quantification of the number of cells with an out-of-plane nucleus in the predicted and ground-truth segmentations. These cells are detected by Mesmer but would be missed by nuclear segmentation-based methods. GI, gastrointestinal. g, Representative image of the expression of multiple informative proteins in a breast cancer sample. h, Predicted segmentation colored by cell lineage. i, Ground-truth segmentation colored by cell lineage. j, Quantification of precision and recall of each cell type in the ground-truth and predicted segmentations demonstrates that Mesmer produces accurate cell-type counts. All scale bars are 50 μm.