
Figure 5: Lineage-aware segmentation yields morphological profiling of cells in the decidua during human pregnancy.
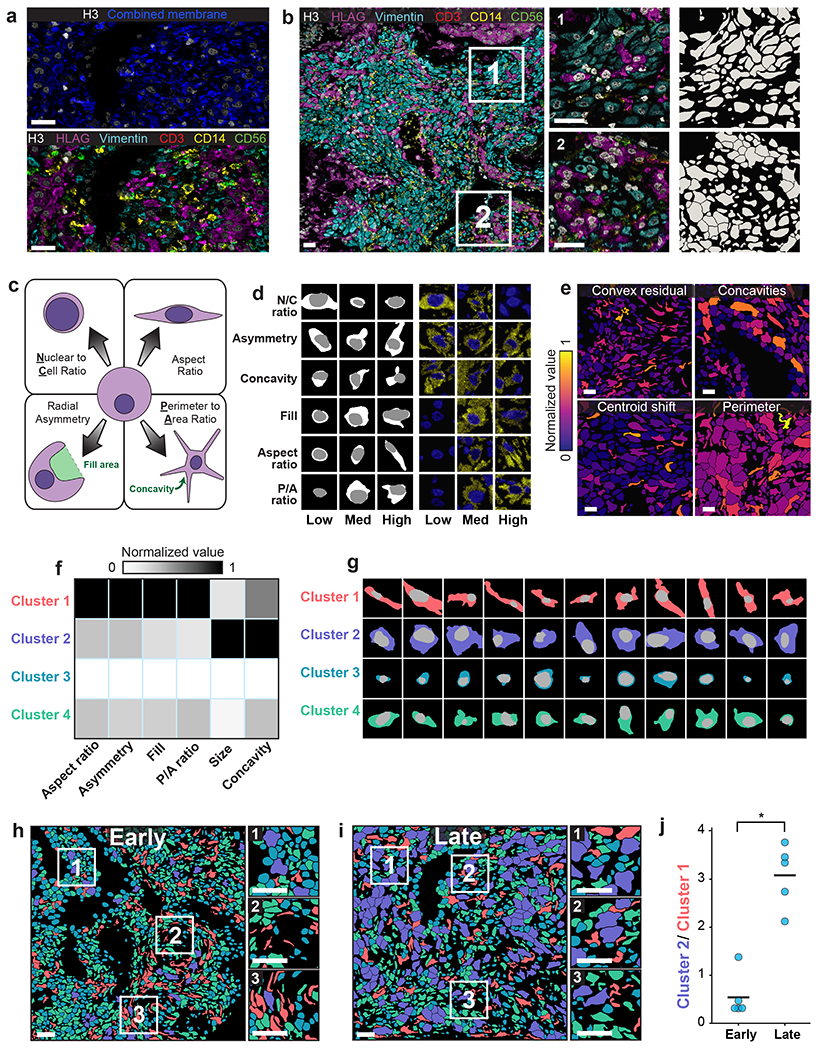
a, Color overlay showcasing the challenge of distinguishing cells with only a single combined membrane channel (top), paired with a version of the same image containing all six channels used for lineage-aware segmentation (bottom). b, Representative image of the diverse morphology of cell types in the human decidua (left), along with insets (right) with corresponding segmentation predictions. c, Diagram illustrating the morphology metrics that we defined to enable automated extraction of cell-shape parameters (Methods). d, Predicted segmentations (left) placing cells on a spectrum from low to high for each morphology metric, along with the corresponding imaging data for those cells (right). e, Cell segmentations in four representative images colored by morphology metrics demonstrate the accurate quantification of diverse features. f, Heatmap of inputs to k-means clustering used to identify distinct cell populations based on cell morphology. g, Example cells belonging to each cluster illustrate the morphological differences between cells belonging to each cluster. h,i Representative images of maternal decidua in early (h) and late (i) gestation, with segmentations colored by cluster. j, Quantification of the ratio between cluster 2 and cluster 1 cells in early pregnancy versus late pregnancy. Cluster 2 cells become more prominent in the later time point while cluster 1 cells become rarer. p=0.0003, two-sample t-test. All scale bars are 50 μm.