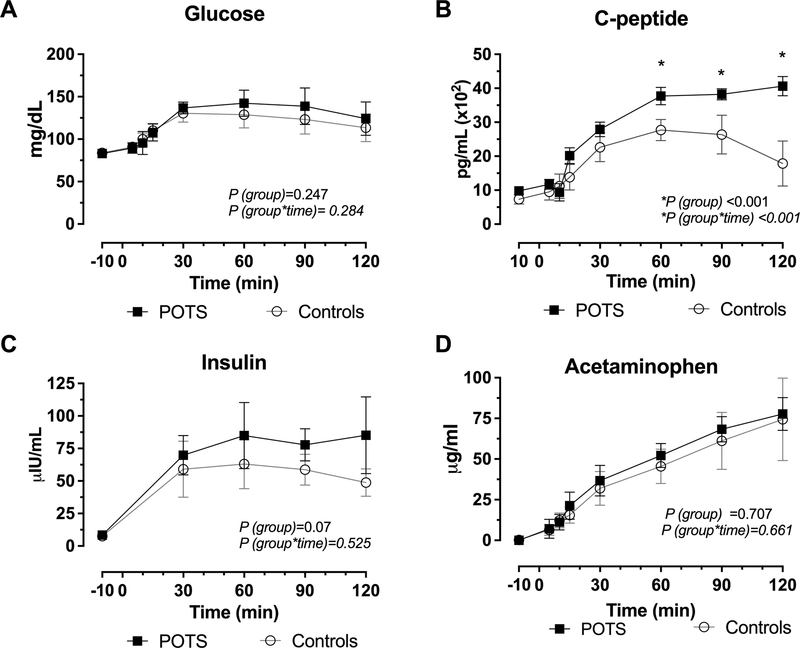
Figure 2. C-peptide Secretion is Increased in POTS following a 75-gr Oral Glucose Consumption.
Blood glucose levels were the same between POTS and controls with similar trends from baseline to 120 minutes (A). POTS patients demonstrated a greater C-peptide secretion compared with controls, P< 0.001 (B). Insulin similarly increased between groups (C). Concentration of acetaminophen in plasma following glucose challenge was the same in POTS and controls (D). P values were calculated using the Generalized Least Squares model, P values were reported for group (POTS versus controls) and group x time (across various time points) for the different GI hormones.

