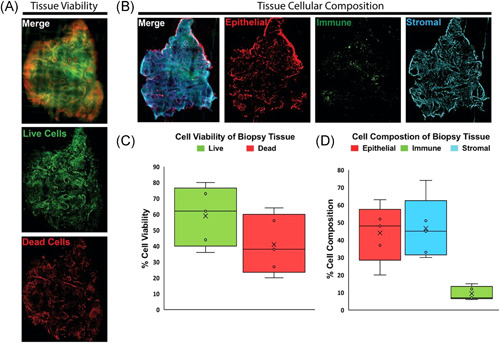
Figure 3.

Viable prostate tissue slice staining benchmarks tissue viability and cellular composition. (A) Fluorescent images of compresstome sectioned tissue slices from PB027 prostatectomy biopsy punches. Slices are stained with ViaStain AOPI Staining Solution labeling live cells in green (acridine orange) and dead cells in red (propidium iodide). (B) Fluorescent images of compresstome sectioned tissue slices from PB027 prostatectomy biopsy punches. Slices are stained with fluorescent‐tagged antibodies for CD45‐FITC (immune cell marker), EpCAM‐PE (epithelial cell marker), CD49a‐Alexa‐647 (fibroblast marker), and nuclei labeled with Hoechst 33342‐blue. (C) Box and whisker plots show the quantified in‐situ tissue viability from patient tissues (n = 5). Whiskers represent maximum and minimum values; other patient values are labeled with open circles “o.” Mean value is labeled with the “X” and boxes represent interquartile range and median. (D) Box and whisker plots show the quantified in situ tissue cellular composition from patient tissues (n = 5). Whiskers represent maximum and minimum values; other patient values are labeled with open circles “o.” Mean value is labeled with the “X” and boxes represent interquartile range and median [Color figure can be viewed at wileyonlinelibrary.com]
