Abstract
Polymorphisms in the human leukocyte antigen (HLA) genes strongly influence autoimmune disease risk. HLA risk alleles may influence thymic selection to increase the frequency of T cell receptors (TCRs) reactive to autoantigens (central hypothesis). However, research in human autoimmunity has provided little evidence supporting the central hypothesis. Here we investigated the influence of HLA alleles on TCR composition at the highly diverse complementarity determining region 3 (CDR3), which confers antigen recognition. We observed unexpectedly strong HLA-CDR3 associations. The strongest association was found at HLA-DRB1 amino acid position 13, the position that mediates genetic risk for multiple autoimmune diseases. We identified multiple CDR3 amino acid features enriched by HLA risk alleles. Moreover, the CDR3 features promoted by HLA risk alleles are more enriched in candidate pathogenic TCRs than control TCRs (e.g., citrullinated-epitope-specific TCRs in rheumatoid arthritis patients). Together, these results provide novel genetic evidence supporting the central hypothesis.
Autoimmune diseases include a broad set of disorders in which the immune system targets host-derived proteins (autoantigens) for destruction. For all autoimmune diseases, the major histocompatibility complex (MHC) locus, harboring the human leukocyte antigen (HLA) genes, accounts for more risk than any other locus in the genome1–5. For example, 12.7% of the phenotypic variance of rheumatoid arthritis (RA), a prototypical autoimmune disease, can be explained by five amino acid polymorphisms within the MHC locus that encode the antigen binding pocket of HLA1. In sharp contrast, all established non-MHC risk alleles in aggregate explain 4% of the phenotypic variance of RA6. Antigenic peptides presented by HLA proteins are recognized by T cell receptors (TCRs), which initiate antigen-specific immune responses. Defining the mechanisms by which HLA risk alleles influence autoimmune risk is a critical ongoing challenge.
One potential explanation for autoimmune risk in the MHC locus is that HLA proteins encoded by risk alleles may increase the presentation of critical autoantigens to the immune system (“peripheral hypothesis” in Fig. 1a)7–9. For example, citrullinated self-peptides have higher binding affinity to HLA proteins encoded by HLA-DRB1 RA risk alleles than those encoded by protective alleles10,11. Similar findings have been reported for type 1 diabetes (T1D)12 and celiac disease (CD)13–15. However, there is an alternative, non-mutually exclusive hypothesis: HLA risk alleles may modulate the risk of autoimmunity by influencing thymic T cell selection, resulting in an increased frequency of autoreactive TCRs (“central hypothesis” in Fig. 1a)16–18. TCR antigen specificity is defined by the hypervariable complementary determining region 3 (CDR3). During T cell development in the thymus, a highly diverse CDR3 repertoire is generated through random V(D)J recombination in immature T cells19. Thymic epithelial cells present self-peptides on HLA proteins, and T cells that cannot generate substantial TCR signaling from any HLA-peptide complex die by neglect (positive selection). However, to protect against autoimmunity, T cells die by apoptosis if TCR signaling from any HLA-peptide complex is too strong (negative selection)20–22. Although multiple studies have demonstrated the importance of thymic T cell selection in autoimmunity23–25, the potential role of the HLA risk alleles in shaping the T cell repertoire during thymic selection has yet to be demonstrated in humans.
Figure 1 |. Underlying hypotheses and overview of our study.
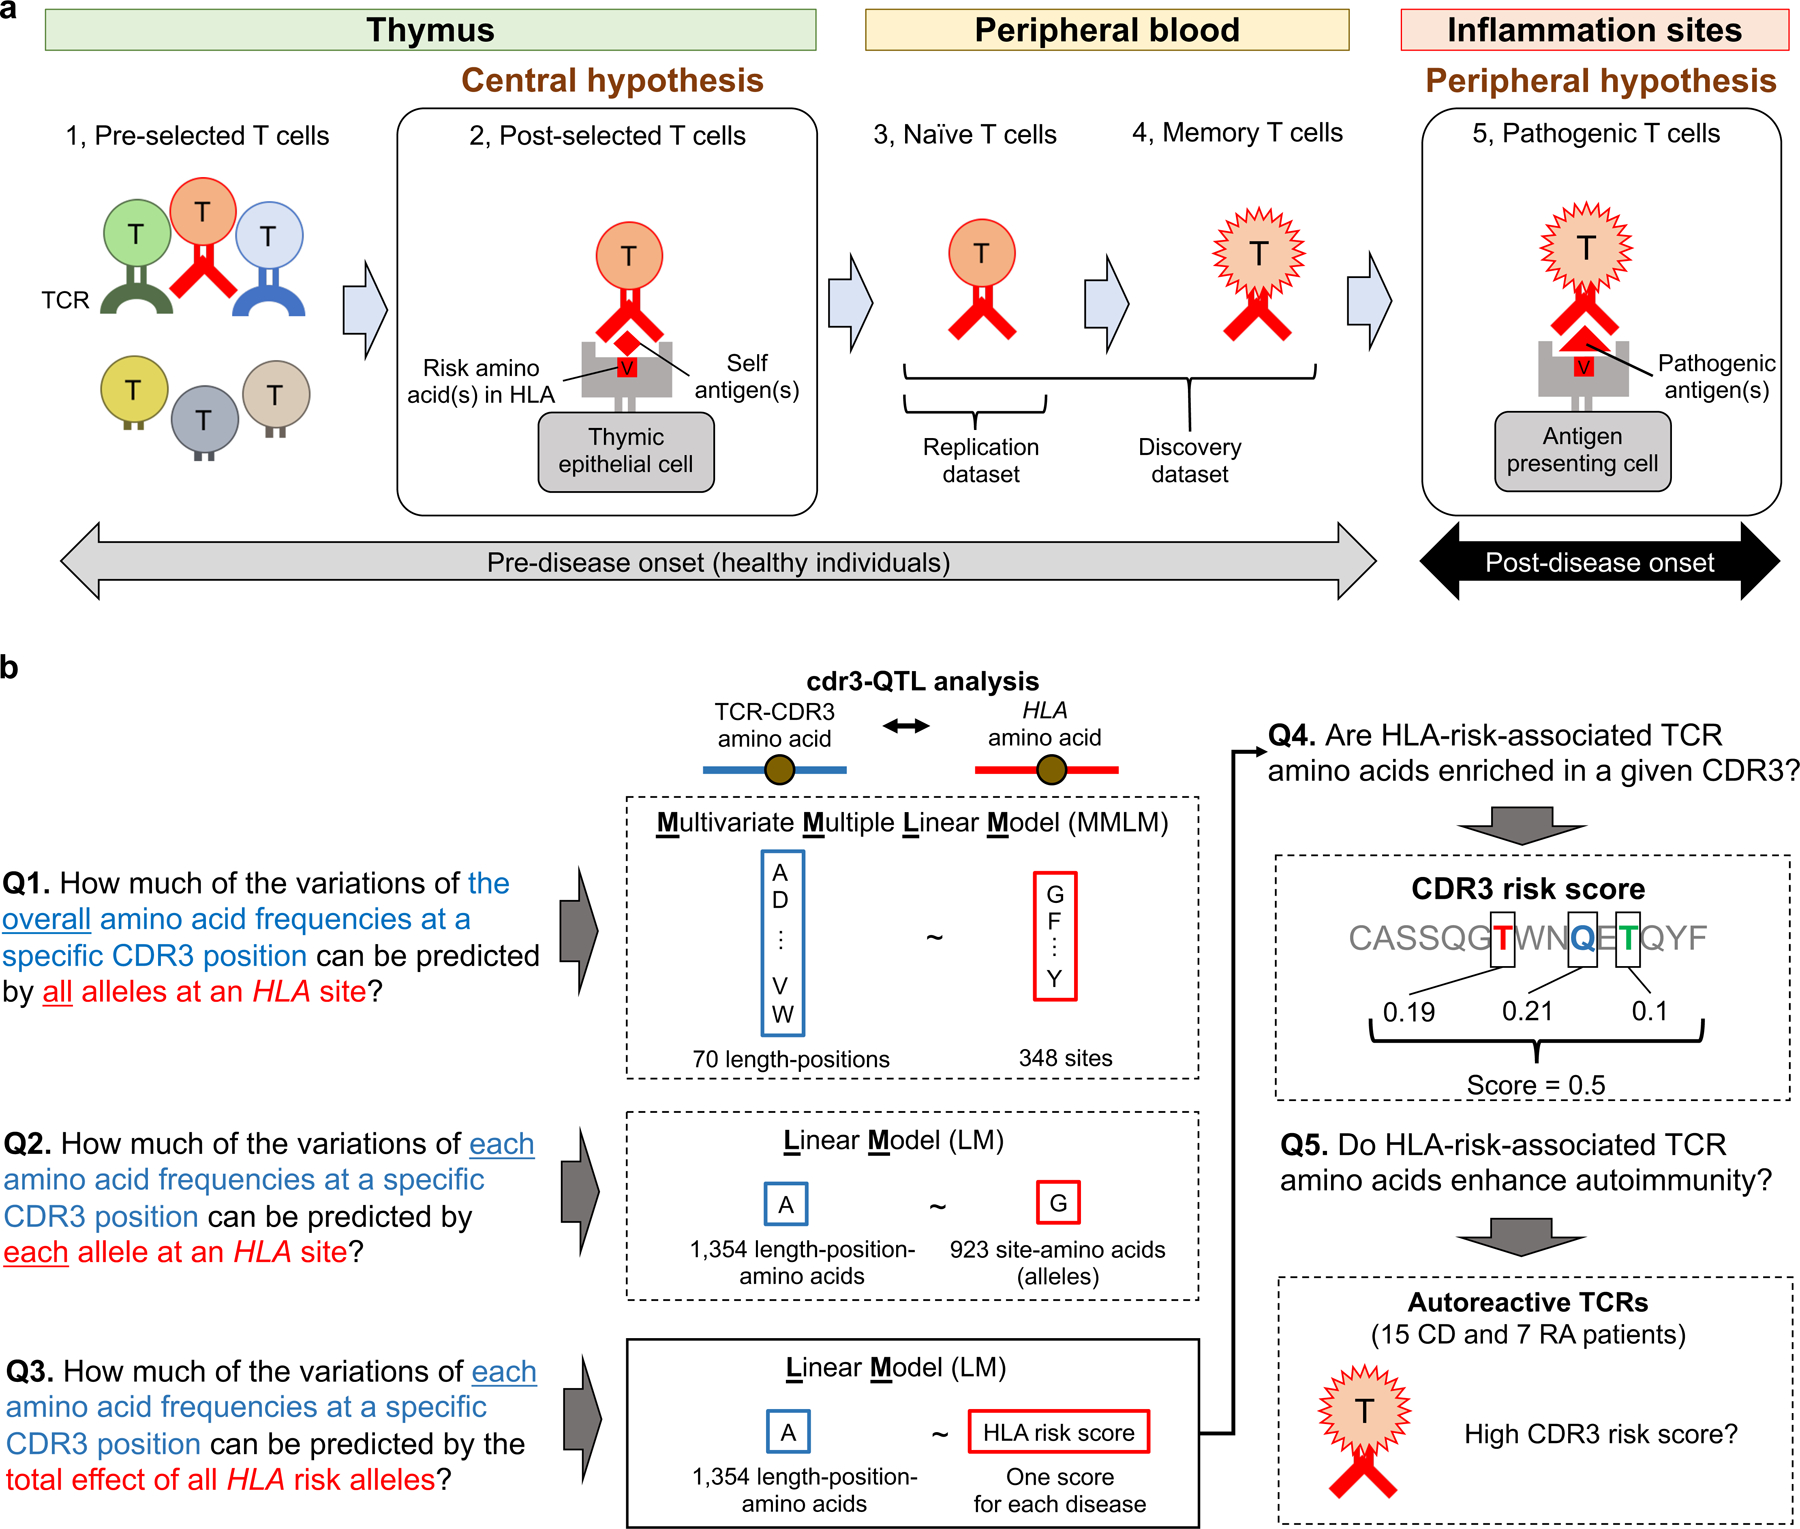
a, Pathogenic roles of HLA in autoimmune disease can be explained by two non-exclusive hypotheses: the central hypothesis and the peripheral hypothesis. This figure illustrates five T cell maturation phases: (1) thymic T cells pre-selection (during T cell development in the thymus, a highly diverse TCR repertoire is generated), (2) thymic T cells post-selection, (3) naïve T cells in the peripheral blood, (4) memory T cells in the peripheral blood, and (5) pathogenic T cells in sites of inflammation. In the central hypothesis, HLA proteins encoded by risk alleles allow more autoreactive TCRs (in red) to survive thymic selection (phase 2). In the peripheral hypothesis, HLA proteins encoded by risk alleles have a higher affinity to critical autoantigens, and therefore can more efficiently induce autoimmunity (phase 5). Using non-productive CDR3s, which experience no thymic selection pressure, we can observe T cell biology in phase 1. Using peripheral blood data, we can observe T cell biology in phases 3 and 4. b, Study overview. We asked five major questions and conducted cdr3-QTL analysis using different models in both discovery and replication datasets (n = 797 donors in total). We conducted downstream investigations using the cdr3-QTL results, which include application of CDR3 risk score (a score indicating the enrichment of CDR3 features favored by HLA risk alleles) to clinical TCR repertoire datasets (n = 22 patients in total). CD, celiac disease; RA, rheumatoid arthritis.
Here we sought to assess whether there is genetic evidence supporting the central hypothesis. We treated the amino acid composition of CDR3 as a quantitative trait and tested its association with HLA alleles; we call this CDR3 quantitative trait loci analysis (cdr3-QTL). We then investigated how HLA autoimmune risk alleles modify amino acid compositions of the CDR3 repertoire. Finally, we assessed whether the CDR3 features favored by HLA autoimmune risk alleles are enriched in candidate pathogenic TCRs. Our novel TCR analysis framework extends understanding of HLA-mediated autoimmune risk and provides novel genetic evidence for the central hypothesis.
RESULTS
Defining CDR3 quantitative traits.
We analyzed a public dataset of deeply-sequenced TCRs from peripheral blood (n = 628 healthy individuals: the discovery dataset26). On average, this dataset has 242,461 unique CDR3 beta chain sequences per individual (Table 1). We treated unique sequence as a single event irrespective of read depth. Among unique sequences, 17.9% harbor a frameshift or stop codon; we refer to these sequences as “non-productive” sequences. For almost all analyses, we include only productive sequences to focus on biologically functional TCRs. One important nuance in our analysis is that CDR3 has variable length; CDR3 with 15 amino acids (L15-CDR3) is the most frequent (Extended Data Fig. 1a-c).
Table 1 |.
Characteristics of datasets used in this study
| Discovery dataset (628 healthy donors) |
Replication dataset (169 healthy donors) |
||
|---|---|---|---|
| Reference | Emerson et al.26 | Chen et al.31 | |
| Sample | Peripheral blood | Naïve CD4+ T cells | |
| TCR data | |||
| Sequencing method | TCR target sequencing | RNA-seq | |
| TCR chains | Beta chain | Alpha and beta chains | |
| Material | DNA | mRNA | |
| n of unique CDR3s per individual | Mean | 242,461 | 1,883 |
| s.d. | 102,355 | 689 | |
| Productive CDR3 ratio | Mean | 82.1% | 94.4% |
| s.d. | 2.0% | 0.96% | |
| Genotype data | |||
| Genome-wide genotype availability | No | Yes | |
| HLA genotypes | Direct typing | Imputed | |
| Ancestry (self-reported) | |||
| European ancestry (n) | 348 | 169 | |
| Asian or Pacific Islander (n) | 19 | - | |
| Black or African American (n) | 8 | - | |
| Native American or Alaska Native (n) | 8 | - | |
| Unknown (n) | 245 | 0 | |
| Age | |||
| Mean | 39.5 | 57.1 | |
| s.d. | 14.0 | 11.4 | |
| Gender | |||
| Male (n) | 324 | 72 | |
| Female (n) | 282 | 97 | |
| Unknown (n) | 22 | 0 | |
| CMV infection status | |||
| Positive (n) | 271 | No data | |
| Negative (n) | 334 | ||
| Unknown (n) | 23 | ||
To understand sequence patterns in CDR3, we calculated the diversity of amino acids at each CDR3 position and the mutual information between all pairs of positions. The middle positions (109 to 112) are generated by random recombination in the thymus; unsurprisingly, these positions have high diversity and little evidence of pairwise mutual information. In contrast, the flanking positions (104–108 and 113–118) are almost exclusively defined by germline encoded V or J genes; hence, these positions have small diversity and higher pairwise mutual information (Extended Data Fig. 1d).
Position-level cdr3-QTL signals.
We first assessed whether HLA alleles explain amino acid frequencies at specific CDR3 positions. To focus on the antigen reactivity of the TCR, we restricted our cdr3-QTL analysis to the ten positions (107–116) of CDR3 that directly contact antigens27. To filter out HLA-V gene associations28, we excluded germline-encoded sequences from CDR3 (Supplementary Figs. 1-4 and Supplementary Note). We refer to locations in HLA amino acid sequences as “sites” and in CDR3 sequences as “positions”. For each CDR3 position, we created a multi-dimensional phenotype vector representing the frequencies of all amino acids. We used a multivariate multiple linear regression model (MMLM) to detect associations between this vector and all alleles at an HLA site; we then assessed their significance with the MANOVA test (Q1 in Fig. 1b and Extended Data Fig. 2). Intuitively, this model estimates how much inter-individual variation in CDR3 amino acid frequencies at a CDR3 position can be predicted by all alleles at an HLA site. We conducted permutation analyses using the MMLM, which demonstrated that the MANOVA test P values were well calibrated (Extended Data Fig. 3).
We included L12-L18 CDR3 (capturing 94.1% of CDR3 sequences) and conducted a total of 24,360 tests: 348 HLA amino acid sites × 70 CDR3 positions (testing each length-position separately). There were 5,718 significant associations (MANOVA test P < 2.1 × 10−6 = 0.05/24,360 total tests; Supplementary Table 1). For 80.8% of the significant associations, the implicated HLA protein was a class II protein (Fig. 2a); for 69.5% of the significant associations, the implicated CDR3 position was a highly diverse middle position (109 to 112). The dominance of class II HLA associations is probably because CD4+ T cells are more prevalent than CD8+ T cells in peripheral blood. In contrast to the strong trans-signals from HLA alleles, cis-regulatory variants within the TCR locus have minimal influences on CDR3 middle positions (Supplementary Fig. 5, Supplementary Tables 2 and 3, and Supplementary Note).
Figure 2 |. HLA-DRB1 site 13 strongly influences CDR3 amino acid composition.
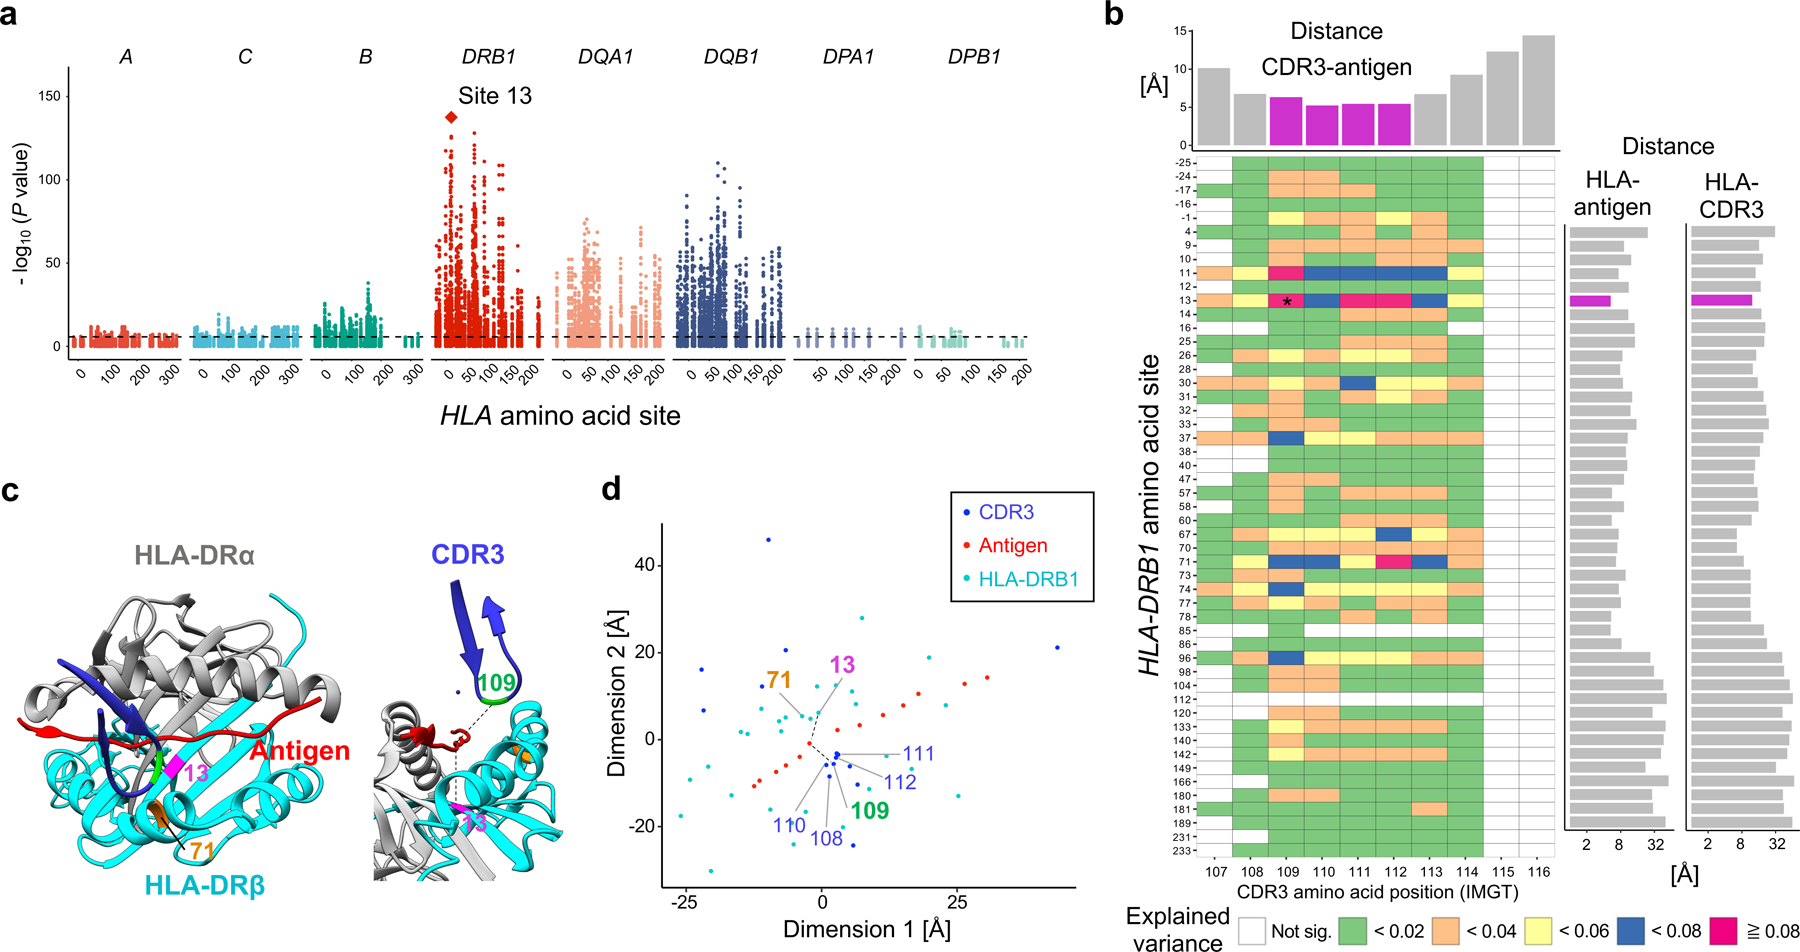
a, MANOVA test P values in the MMLM analysis (n = 628; the discovery dataset). At each HLA site, P values for all CDR3 phenotypes are plotted. The HLA site with the lowest P value (HLA-DRB1 site 13) is highlighted by a diamond. The dashed line indicates the significance threshold with the Bonferroni multiple testing correction (P < 0.05/24,360 total tests). b, Variance explained in the MMLM analysis (n = 628; the discovery dataset). For each HLA site-CDR3 position pair, the largest variance explained across all CDR3 lengths is depicted in a heatmap. Here we show all polymorphic sites of HLA-DRB1 (other HLA genes are in Extended Data Fig. 4). The pair with the largest variance is indicated by an asterisk. Above the heatmap, we present the shortest distance between each CDR3 position and any antigenic peptide residue; middle positions of CDR3 are highlighted in magenta. On the right of the heatmap, we present the shortest distance between each HLA-DRB1 site and any antigenic peptide residue (the left bar plot) and that between each HLA-DRB1 site and any CDR3 position (the right bar plot); site 13 is highlighted in magenta. Distances were averaged across the five X-ray crystallography structures (Methods). c, Structure of HLA-DR, the antigenic peptide, and CDR3 (Protein Data Bank 2IAM). HLA-DRB1 sites 13 and 71 and CDR3 position 109 are highlighted in magenta, orange, and green, respectively. On the left, we depict the antigen (red) and the beta chain CDR3 (dark blue) overlaid onto HLA-DR molecules, looking into the binding groove. On the right, we depict the same complex from a side view. The shortest paths between site 13 and antigenic peptide and those between position 109 to antigenic peptide were shown in black lines. d, Two-dimensional embedding plot based on the pairwise distances between amino acids of HLA-DRB1, the CDR3 loop, and the antigenic peptide. We down-weighted the distances between HLA and CDR3 so that their antigen-mediated indirect interaction was highlighted (Methods). The shortest paths between site 13 and antigenic peptide and those between position 109 and antigenic peptide are shown in black lines as in c; the paths are well preserved in this embedding.
The strongest association in the MMLM analysis was between HLA-DRB1 site 13 and L13-CDR3 position 109 (MANOVA test P = 2.7 × 10-138; Fig. 2a-c, Extended Data Fig. 4 and Supplementary Table 1). Although CDR3 middle positions are generated by stochastic processes in the thymus, HLA-DRB1 site 13 explained a striking 9.3% of inter-individual variance in amino acid usage at L13-CDR3 position 109, which is comparable to the variance in V gene usage explained by HLA alleles28. For each CDR3 length, the HLA site that explained the most variance in amino acid usage was HLA-DRB1 site 13 (Supplementary Fig. 6). Even when we controlled the effect of potential confounders (ancestry, age, sex, and cytomegalovirus infection status, which can influence the TCR repertoire26), HLA-DRB1 site 13 continued to explain the most variance (Supplementary Fig. 7). CDR3 amino acid frequencies were less significantly associated with classical HLA alleles than to HLA-DRB1 site 13 (Supplementary Table 4 and Supplementary Fig. 8). Intriguingly, HLA-DRB1 site 13 is known to drive the risk of multiple autoimmune diseases. This is the residue that explains the most heritability for RA1,29 and for juvenile idiopathic arthritis30. It represents the strongest association to T1D following HLA-DQB1 site 572.
To reproduce these effects, we obtained a replication data set of 169 healthy individuals consisting of RNA-seq data from sorted naïve CD4+ T cells (1,883 unique CDR3 beta chain sequences per individual; Table 1)31. We observed that the variance explained in the MMLM analysis was similar between replication and discovery datasets (Pearson’s r = 0.65), and the strongest association was again between HLA-DRB1 site 13 and L13-CDR3 position 109 (Extended Data Fig. 5a and Supplementary Table 5).
To assess whether there were independent effects outside of HLA-DRB1 site 13, we conducted serial conditional haplotype analyses within HLA-DRB1 in the discovery data set (Methods). In order of descending significance, sites 71, 32, 74, 86 and 30 of HLA-DRB1 showed independently significant signals (Fig. 3 and Extended Data Fig. 6a). Including site 13, these six sites in total explained up to 20% of the variance in CDR3 middle position amino acid frequencies, with about half of this variance explained by site 13 (Extended Data Fig. 6b). Among these sites, three (13, 71, and 74) face the P4 antigen binding pocket of HLA-DRB1, suggesting that the HLA-DRB1 P4 pocket plays a critical role in shaping the TCR repertoire (Extended Data Fig. 6a). Further conditional analyses outside of HLA-DRB1 revealed signals at both class I and II HLA genes. In order of descending significance, we observed independently significant associations at HLA-B, HLA-DQB1, HLA-DPB1, and HLA-DQA1 (Extended Data Fig. 7).
Figure 3 |. The results of conditional haplotype analysis.
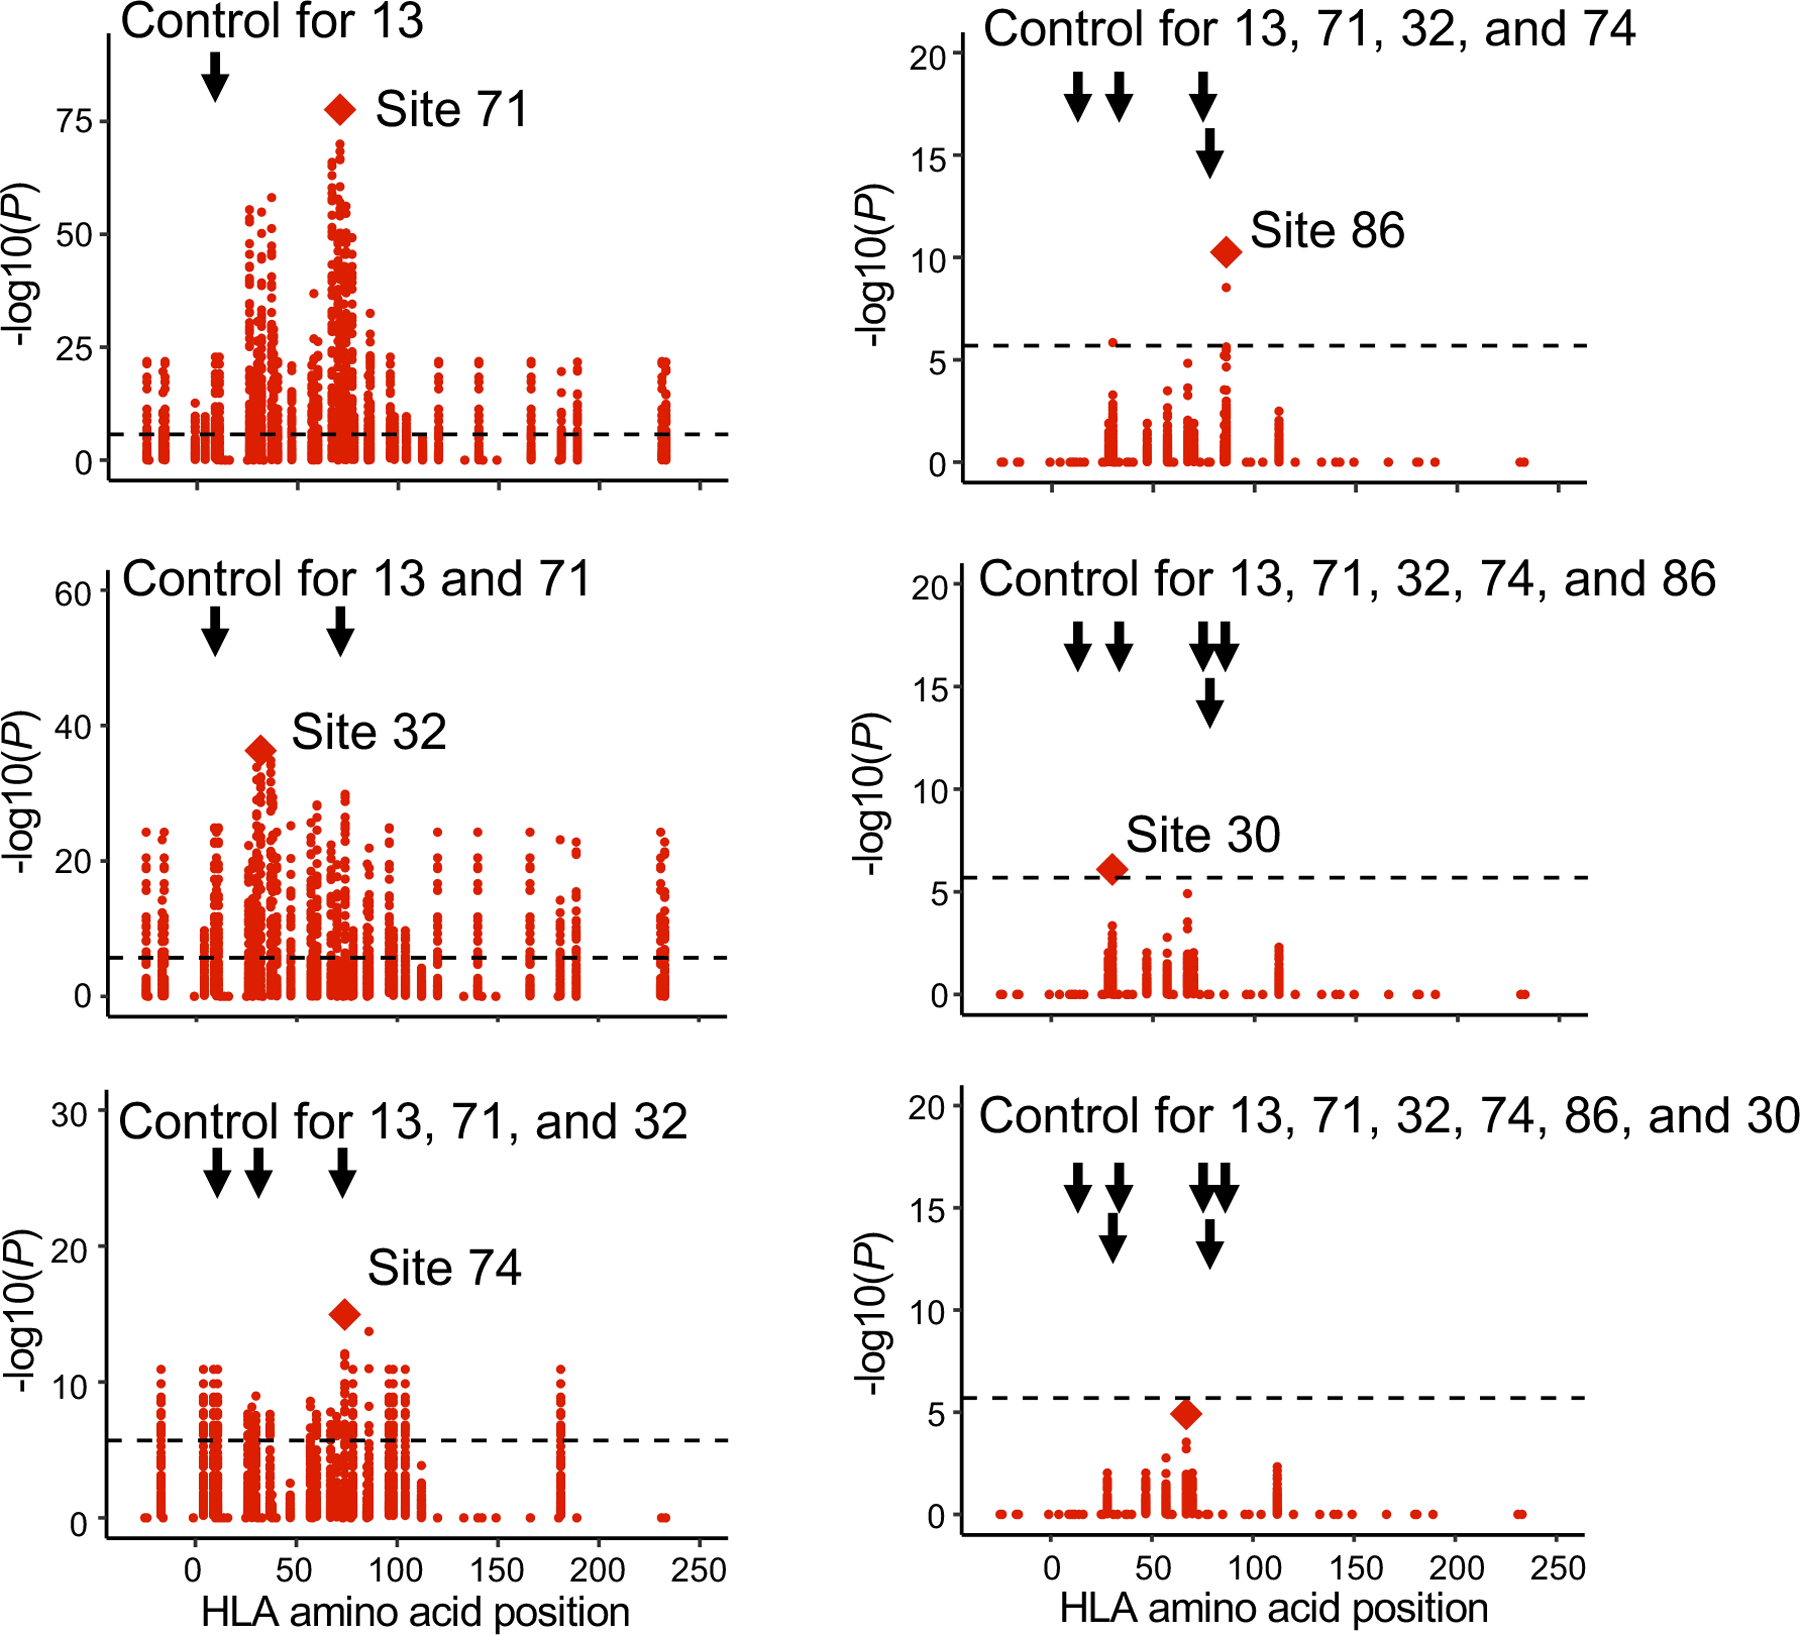
Conditional haplotype analysis within HLA-DRB1 (n = 628; MMLM; the discovery dataset). To detect independent cdr3-QTL signals within HLA-DRB1, we conducted a conditional haplotype analysis using MMLM by controlling all effects coming from specific sites of HLA-DRB1 gene. The strongest cdr3-QTL signal was found at site 13 of HLA-DRB1. Therefore, in the first round of the conditional analysis, we conducted cdr3-QTL analysis by controlling the effects coming from site 13. The null model consisted of haplotypes defined only by residues at site 13. The full model consisted of haplotypes defined by the combination of residues at site 13 and the target site; addition of the target site may result in k additional unique haplotypes. We tested whether the creation of k additional haplotype groups improved the model fit. In this analysis, the strongest signal was found at site 71 of HLA-DRB1. Therefore, in the second round of the conditional analysis, we conducted cdr3-QTL analysis by controlling all effects coming from site 13 and 71. We repeated these processes sequentially within HLA-DRB1 until we did not observe further significant signals (P > 0.05/24,360 total tests). We reported MANOVA test P values.
MHC-peptide-TCR complex structures.
To understand whether these associations are related to the positioning of residues in the MHC-peptide-TCR complex, we analyzed five X-ray crystallography-based structures32–34. As expected, the antigenic peptide was closer to the middle positions of CDR3, where the cdr3-QTL associations were concentrated, than to the flanking positions (6.0 Å vs 14.1 Å on average; one-sided t test P = 5.3 × 10⁻¹⁸; Fig. 2b, Extended Data Fig. 8 and ref. 27). Among all polymorphic sites in HLA-DRB1, the site with the most significant cdr3-QTL effect, HLA-DRB1 site 13, was the site closest to the antigenic peptide (5.3 Å on average; Fig. 2b). In contrast, this site was 12.2 Å away from CDR3 residues on average. Across the five structures examined, HLA-DRB1 site 13 was closer to antigenic peptide residues than CDR3 residues (one-sided paired t test P = 5.6 × 10⁻⁸; Fig. 2b and Extended Data Fig. 6c). All other HLA-DRB1 sites with significant cdr3-QTL effects were also closer to antigenic peptide residues than to CDR3 residues (one-sided paired t test P < 0.023; Extended Data Fig. 6c and Supplementary Fig. 9a).
These results suggested that antigenic peptides may mediate cdr3-QTL associations. To examine this possibility, we calculated pairwise distances between HLA, TCR, and antigen amino acids and embedded them into a two-dimensional space. In this embedding, we preserved distances important for antigen recognition: distances between HLA-DRB1 and antigens and those between TCR and antigens (Pearson’s r > 0.9; Supplementary Fig. 9b and Supplementary Note). We observed that in the embedded space, HLA-DRB1 site 13 and CDR3 position 109 were close to a common set of antigen positions, arguing that the association between site 13 and position 109 was mediated by an indirect physical interaction through antigenic peptide residues (Fig. 2d).
Amino acid-level cdr3-QTL signals.
Our cdr3-QTL analyses have so far focused on inter-individual variance in overall CDR3 composition explained by HLA alleles. We next applied a linear regression model (LM) to examine more specific relationships: for all possible pairs of CDR3 amino acids and HLA alleles, we tested how much inter-individual variation in the CDR3 amino acid frequency could be predicted by the HLA allele count (Q2 in Fig. 1b and Extended Data Fig. 2). Permutation analyses using the LM similarly demonstrated that the P values were well calibrated (Supplementary Fig. 10). Of the 1,249,742 total tests (923 HLA amino acid alleles × 1,354 CDR3 phenotypes: length-position-amino acid combinations), 15,060 of them were significant (P < 4.0 × 10−8 = 0.05/1,249,742 total tests; Supplementary Table 6). A total of 388 of 1,354 CDR3 phenotypes were associated with at least one HLA amino acid allele; we detected multiple CDR3 modification patterns (Supplementary Fig. 11). The effect sizes from the discovery and replication dataset were significantly correlated (Pearson’s r = 0.76; P = 5.4 × 10−70; Extended Data Fig. 5 and Supplementary Table 7). Using this model, we re-evaluated potential impacts of confounders and confirmed that those effects on cdr3-QTL results were minimal (Supplementary Fig. 12).
Our results suggested that the HLA-peptide complex drives associations between HLA alleles and CDR3 phenotypes. However, some associations could be mediated by HLA interactions with V and J genes. To rule out this possibility, we used linear mixed models (LMM) to re-estimate cdr3-QTL effects while accounting for the potential effects of V and J genes. In these models, cdr3-QTL signals were unchanged, confirming that these associations are independent of V and J gene usage (Supplementary Figs. 1c and 2c).
Thymic selection may be driving HLA-CDR3 associations.
To investigate the biological site and the timing of HLA allelic effects on TCR composition, we considered five T cell phases: (1) thymic T cells pre-selection, (2) thymic T cells post-selection, (3) naïve T cells in the peripheral blood, (4) memory T cells in the peripheral blood, and (5) memory T cells after disease-onset (Fig. 1a). The consistent cdr3-QTLs between peripheral blood (the discovery dataset with both naïve and memory T cells) and naïve T cells (the replication dataset) suggest cdr3-QTL influence prior to the development of the naïve TCR repertoire (phase 1 or phase 2). To assess the possibility of cdr3-QTL effects during phase 1, we tested for cdr3-QTLs among non-productive TCRs and productive CDR3s with TRBV21–1, a pseudogene that renders the TCR non-functional, and we observed no evidence of association (Fig. 4a,b and Supplementary Fig. 13). These results argue against the hypothesis that cdr3-QTLs reflect genetic biases in random recombination prior to thymic selection. Next, we evaluated the possibility that cdr3-QTLs are driven by antigen presentation in the periphery, during T cell phase 4. cdr3-QTL signals were not enriched among clonally expanded cell populations (Supplementary Fig. 14). Moreover, including clone size as a weight in fact attenuated cdr3-QTL signals (explained variance reduced by 47.3% on average; Fig. 4c,d). Taken together, these results argue that cdr3-QTLs reflect thymic selection favoring different CDR3 sequence features in the context of different HLA alleles (see Supplementary Note for more detailed discussion).
Figure 4 |. cdr3-QTL effects were not observed for non-productive CDR3 and attenuated by clonal expansion.
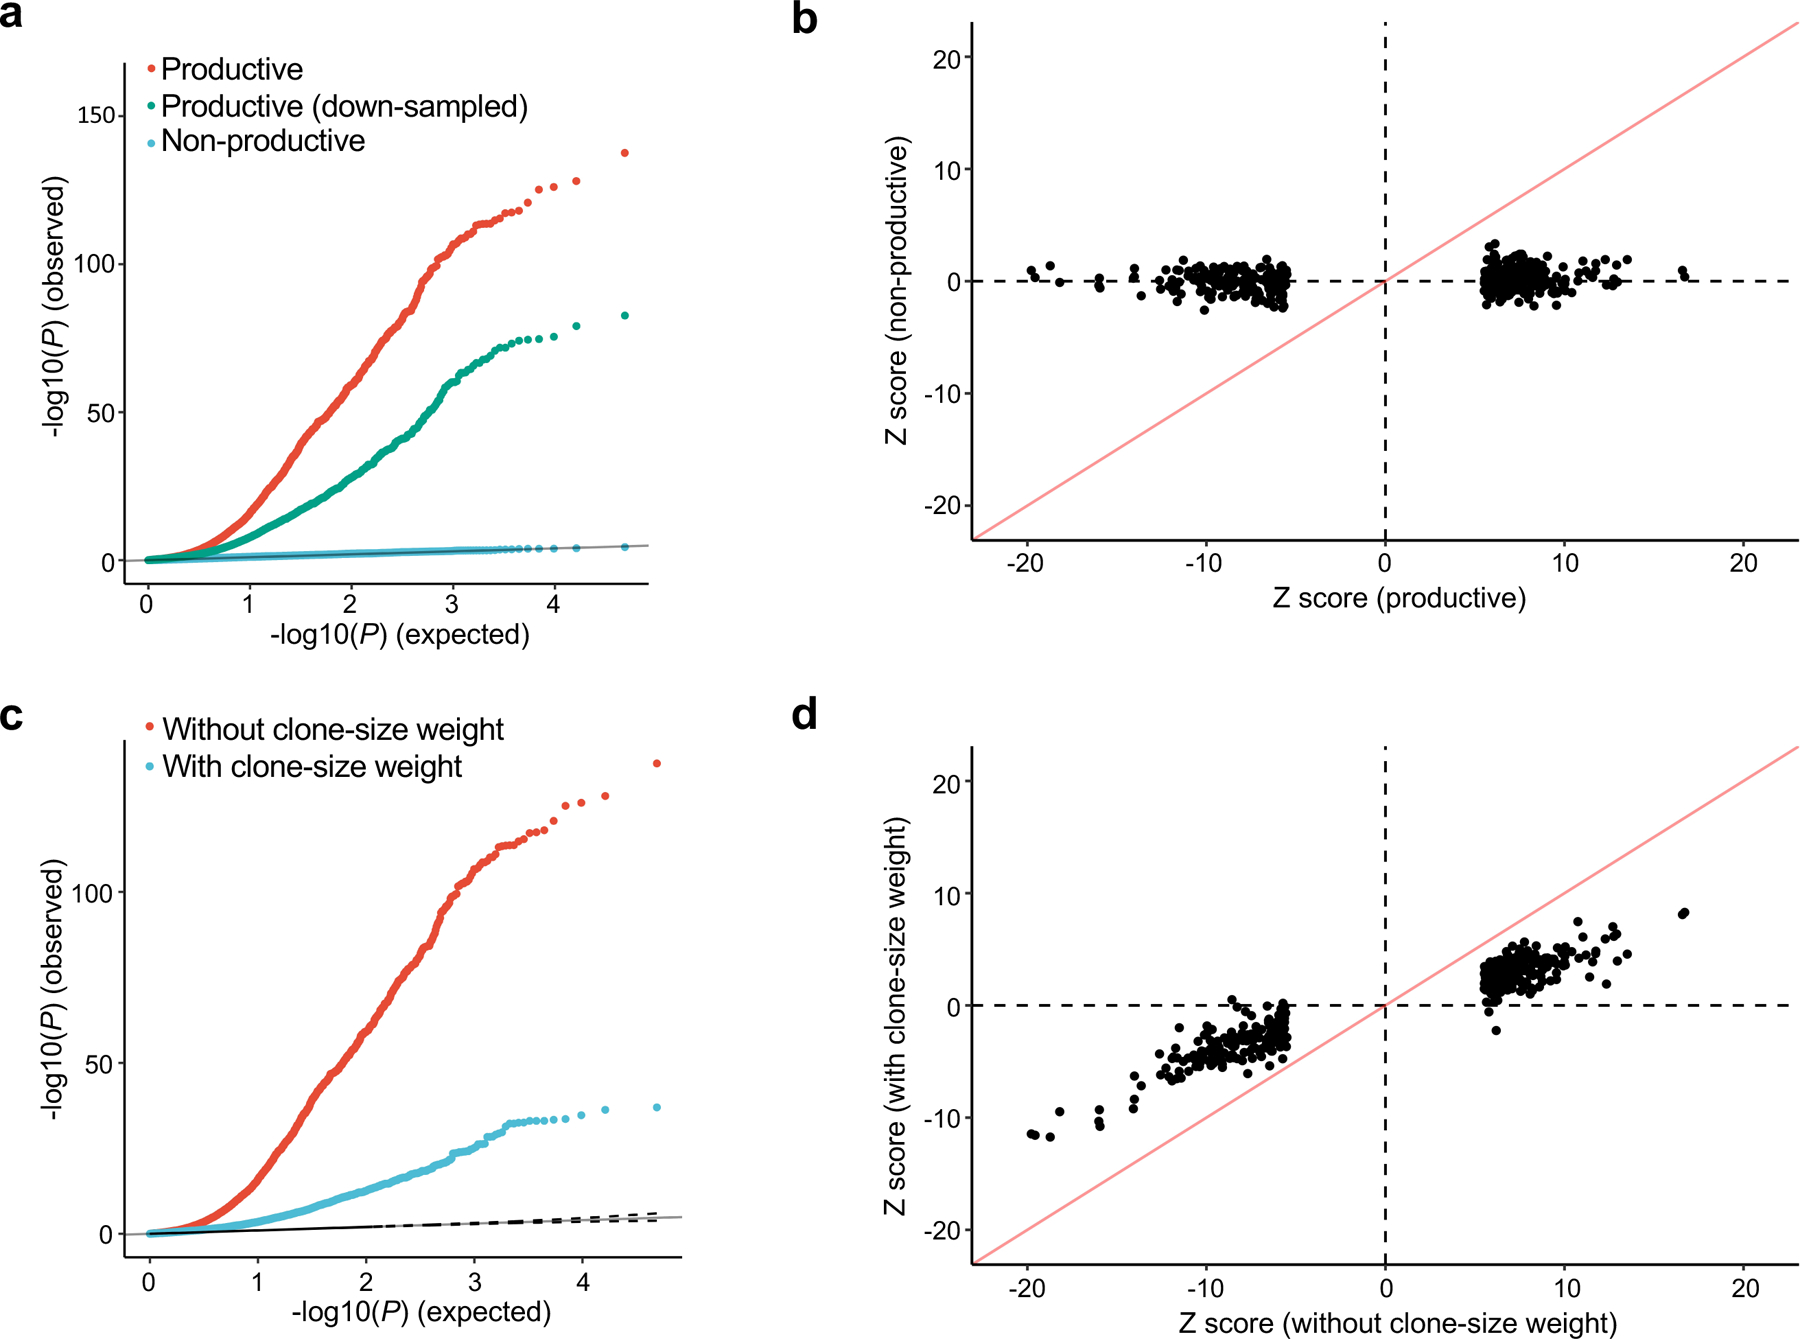
a, QQ plot of the MMLM analysis in three different settings (n = 628; the discovery dataset): (1) associations with productive CDR3 sequences (the primary analysis, in red), (2) productive CDR3 sequences down-sampled to match the number of non-productive sequences (in green), and (3) non-productive CDR3 sequences (in blue). We reported MANOVA test P values. b, Z score comparison between the LM analyses using productive (the primary analysis) and those using non-productive CDR3 (n = 628; the discovery dataset). c, QQ plot of the MMLM analysis in two different settings (n = 628; the discovery dataset): (1) not considering clone size (the primary analysis, in red), and (2) weighting observations by clone size when calculating CDR3 amino acid frequencies (blue). We reported MANOVA test P values. d, Z score comparison between the LM analyses with and without clone-size weight (n = 628; the discovery dataset). The analyses in b and d were restricted to the 388 CDR3 phenotypes (length-position-amino acid combinations) that had at least one significant association in the primary LM analysis (P < 0.05/1,249,742 total tests; the discovery dataset) and the HLA amino acid allele that had the lowest P value for that phenotype. We used P values from two-sided linear regression test.
CDR3 patterns associated with autoimmunity risk.
Since the HLA site that explained the most variance in CDR3 composition (HLA-DRB1 site 13) was the site with the strongest association to RA risk, we hypothesized that HLA risk for RA could be partially mediated by TCR composition. If HLA risk for RA is mediated by cdr3-QTLs, the effect sizes of the six possible amino acid alleles at HLA-DRB1 site 13 on RA risk should track with their effects on CDR3 composition. Using the discovery dataset, we examined the results at L14-CDR3 position 110, the L14 position for which HLA-DRB1 site 13 had the strongest signal (MANOVA test P = 6.7 × 10−126; Supplementary Table 1). We observed that HLA-DRB1 site 13 amino acids that raise the risk for RA increase the frequency of aspartic acid (a negatively charged amino acid), while those that protect against RA decrease the frequency of aspartic acid, and that the magnitude of these effects are strongly correlated (Pearson’s r = 0.92; Fig. 5). Similar findings were observed for glutamic acid, another negatively charged amino acid (r = 0.76). Interestingly, we observed the opposite finding for lysine, a positively charged amino acid (r = −0.90; Fig. 5). These results were partially observed in other CDR3 lengths (Supplementary Fig. 15) and raise the hypothesis that negative charge at position 110 is involved in the pathogenesis of RA.
Figure 5 |. Negative charge at CDR3 position 110 might be involved in the pathogenesis of RA.
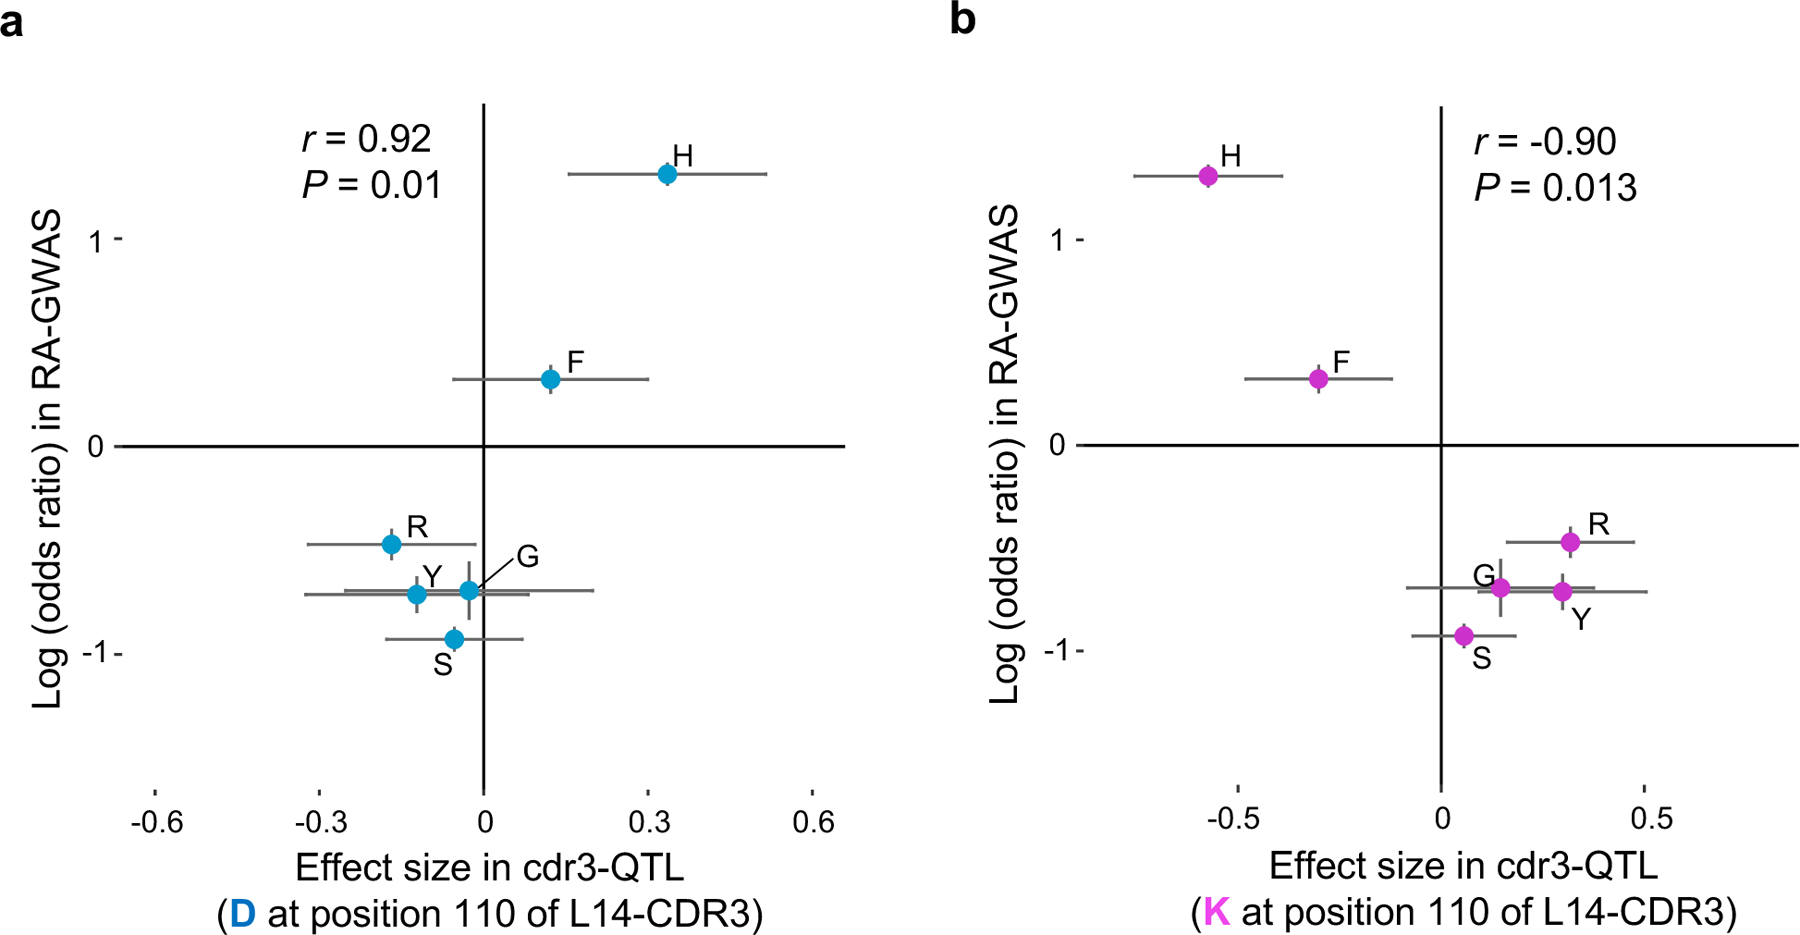
a, The cdr3-QTL effect sizes in the LM analysis for aspartic acid (D) usage at position 110 of L14-CDR3 for the six possible amino acids at HLA-DRB1 site 13 (n = 628; the discovery dataset; linear regression test) plotted against their effect size (log of odds ratio) in RA-GWAS1. The error bar indicates ± 2 × s.e. Pearson’s r is provided. b, The same plot as in a but for lysine (K).
Motivated by these results, we aimed to extend our understanding of CDR3 amino acid patterns associated with autoimmune disease risk. Since autoimmune risk is driven by multiple HLA alleles, analysis of a single HLA amino acid allele might fail to detect important CDR3 patterns. To directly infer the comprehensive influence of HLA alleles on CDR3 restriction, we defined a multi-allelic HLA risk score for RA, T1D, and CD. Briefly, this HLA risk score is a genetic risk score that is a product of two parameters: (i) the number of disease-associated HLA haplotypes of each individual, and (ii) the effect sizes of each haplotype estimated in the previous genetic studies1,2,5 (Fig. 6a and Supplementary Table 8). We calculated HLA risk scores in the discovery dataset and tested for CDR3 associations using a linear regression model (Q3 in Fig. 1b). Out of 1,354 CDR3 phenotypes (combinations of length, positions, and amino acid), we observed significant associations for 83, 187, and 119 phenotypes for RA, T1D, and CD risk scores, respectively (P < 3.7 × 10−5 = 0.05/1,354 total tests; Supplementary Table 9). We observed weaker associations to V/J gene usage than to CDR3 patterns (Supplementary Fig. 16), suggesting that the main target of autoimmune risk is CDR3 composition rather than V/J genes.
Figure 6 |. CDR3 amino acid patterns influenced by HLA risk for RA, T1D, and CD.
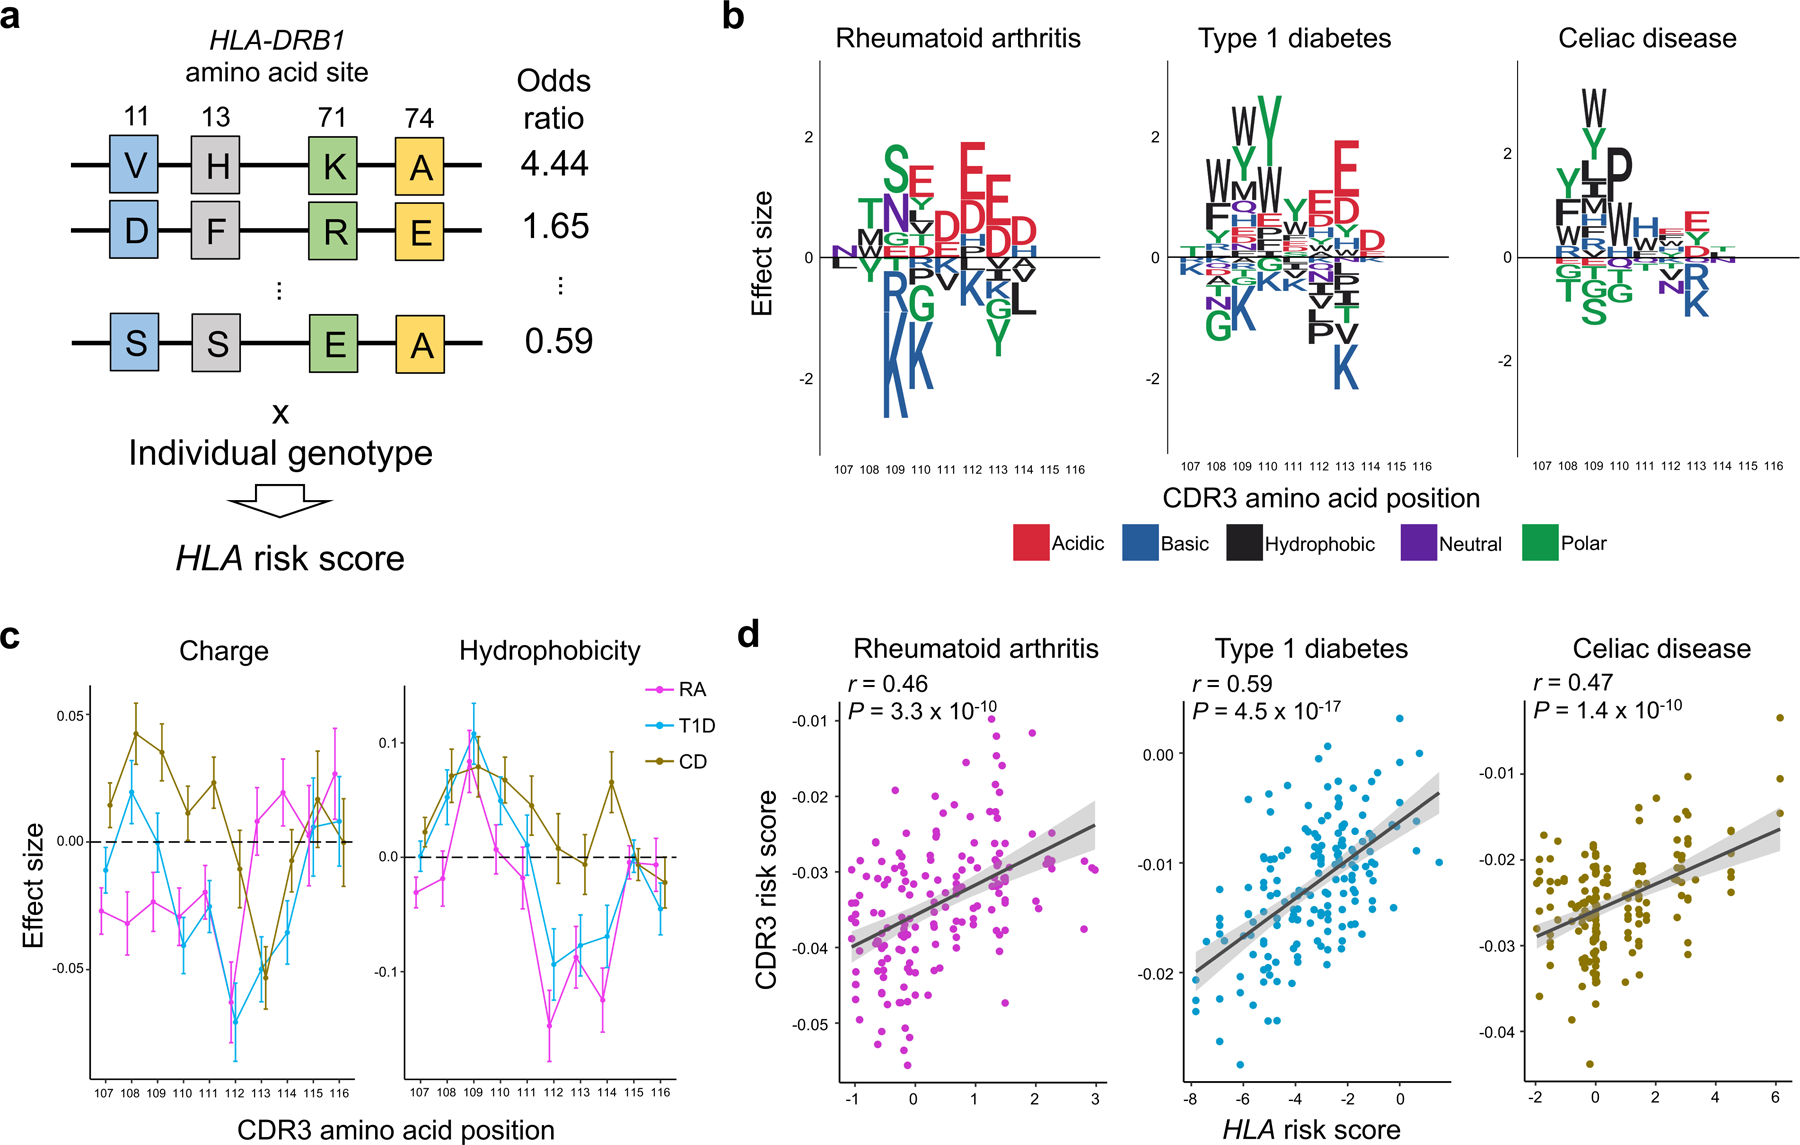
a, Strategy to quantify per-individual MHC-wide risk of autoimmune diseases (HLA risk score) based on effect size estimates of disease-associated HLA haplotypes in previous studies. Haplotypes are depicted as joint amino acid assignments for the polymorphic sites in HLA-DRB1 (rows). The effect size (logarithm of odds ratio) for each haplotype is multiplied by the individual’s haplotype count (0, 1, 2, if the individual is null, heterozygous, or homozygous, respectively) to compute the HLA risk score. b, CDR3 amino acids influenced by HLA risk score for RA, T1D and CD. We conducted the LM analysis using the HLA risk score for each of these diseases separately, testing for differential usage of each amino acid at each position of each length CDR3 (n = 628; the discovery dataset). To create a sequence logo for each disease, the effect sizes of significant associations for each amino acid at a given position were summed across L12-L18 CDR3s (P < 0.05/1,354 total test). We used P values from two-sided linear regression test. c, CDR3 amino acid features influenced by HLA risk score. We conducted the LM analysis using HLA risk score for RA, T1D, and CD; the CDR3 phenotypes were amino acid features at each position of each length CDR3 (n = 628; the discovery dataset). The effect sizes for each feature at a given position were meta-analyzed across different lengths of CDR3 using a fixed effect model and the meta-analyzed effect sizes of two features are provided. The error bar indicates ± 2 × s.e. (see Extended Data Fig. 10 for other features). d, The correlation between HLA risk score and CDR3 risk score in the replication dataset for RA, T1D, and CD (n = 169; naïve CD4+ T cells). The error bands indicate 95% confidence interval for predictions from a fitted linear model. Pearson’s r is provided.
To illustrate the CDR3 amino acid patterns associated with autoimmunity risk alleles, we created sequence logos (Fig. 6b and Extended Data Fig. 9). Interestingly, we noted that amino acids with similar biochemical features demonstrated similar trends. This suggested that there may be latent biochemical features driving these disease-specific cdr3-QTLs. To quantify these trends, we examined the five broad aggregate amino acid features35: charge, hydrophobicity, refractivity, propensity for canonical secondary structures, and molecular size (Methods). At each position of each length of CDR3, we calculated the weighted average of each feature to create 350 CDR3 phenotypes in total (5 features × 70 positions). We then used a linear regression framework to test for associations between these phenotypes and HLA risk scores (Fig. 6c, Extended Data Fig. 10 and Supplementary Table 10). Consistent with the above results, RA risk was associated with decreased amino acid charge at multiple positions, including position 110 (P < 3.1 × 10⁻⁵; Fig. 6c). Interestingly, increased hydrophobicity at position 109 was associated with the HLA risk score of all three diseases (P < 2.4 × 10⁻⁵; Fig. 6c). Stadinksi et al. have proposed that elevated hydrophobicity at this position promotes T cell autoreactivity based on experimental work in a type 1 diabetes mouse model36. Our results reveal a genetic basis for this CDR3 phenotype and demonstrate its relevance in humans with respect to multiple autoimmune diseases. Moreover, our results suggest that there are several other CDR3 biochemical features associated with T1D, CD, and RA risk (Extended Data Fig. 10).
It is possible that these CDR3 patterns associated with autoimmune disease risk indicate T cell reactivity to pathogenic antigens. To enable this line of investigation, we developed a scoring system that quantifies the enrichment of HLA autoimmune risk-associated patterns (we refer to this as the CDR3 risk score; Q4 in Fig. 1b). Briefly, the CDR3 risk score is the sum of HLA risk regression coefficients of which target CDR3 phenotype exists in a given CDR3 sequence (Supplementary Fig. 17 and Supplementary Note). We used only CDR3 phenotypes (combinations of lengths, positions, and amino acids) that were significantly associated with the HLA risk score in the above analysis (Supplementary Table 9). To evaluate the performance of CDR3 risk scoring, we applied this score to the independent replication dataset of naïve CD4+ T cells (n = 169). Reassuringly, CDR3 risk scores were significantly correlated with the HLA risk scores; Pearson’s r was 0.46, 0.59, and 0.47 for RA, T1D, and CD, respectively (Fig. 6d). We thus established and validated a method to quantify CDR3 patterns associated with autoimmunity.
Pathogenic CD4+ T cells possess high CDR3 risk scores.
Finally, we applied the CDR3 risk score to CD4+ T cell populations whose TCRs recognize candidate pathogenic antigens (Q5 in Fig. 1b). If the central hypothesis is true, TCRs reactive to pathogenic antigens may have higher CDR3 risk scores. Although our understanding about pathogenic antigens in human autoimmunity is generally limited, promising candidates have emerged for a few autoimmune diseases, and we focused on our analyses on these.
We first analyzed public datasets of TCR sequences from CD patients. The hallmark of CD is the immune reaction to gliadin, a component of gluten. Several deamidated epitopes have been reported to be pathogenic in CD: α-I, α-II, and ω-II gliadin37. From previous studies that identified antigen-specific T cell populations with HLA-DQ2 tetramers, we collected TCR sequences specific to these three epitopes, and control non-specific TCRs38–40. In total, seven TCRs were specific to α-I gliadin (n = 4 patients), 92 TCRs were specific to α-II gliadin (n = 13 patients), eight TCRs were specific to ω-II gliadin (n = 2 patients), and 49 TCRs were non-specific (n = 3 patients) (Supplementary Table 11). We observed that gliadin-specific TCRs had higher CD-CDR3 risk score than control TCRs (one-sided t test P = 0.0058; Fig. 7a). When we restricted this analysis to individual epitopes, we observed that only α-II gliadin-specific TCRs had significantly higher CD-CDR3 risk score than control TCRs (one-sided t test P = 0.0021; Supplementary Table 11). The inter-epitope differences in CDR3 risk score might be useful to differentiate causal epitopes from those targeted by epitope spreading. However, the limited number of TCRs specific for individual epitopes warrants cautious interpretation of these results. Interestingly, the CDR3 sequence with the highest score was reactive to α-II gliadin and featured arginine at position 109, which is known to be important for the recognition of α-II gliadin40,41 (Fig. 7a). Recognizing that subtle HLA genotype differences could affect CDR3 scores, we next conducted an intra-individual analysis by restricting the analysis to TCRs from the three individuals for whom control TCR data were available. Even in this stringent analysis, we still observed significant differences in CD-CDR3 risk score between α-II gliadin-specific and control TCRs (P = 0.04; a linear regression model adjusted for donor-level effects).
Figure 7 |. Pathogenic CD4+ T cells possess high CDR3 risk score.
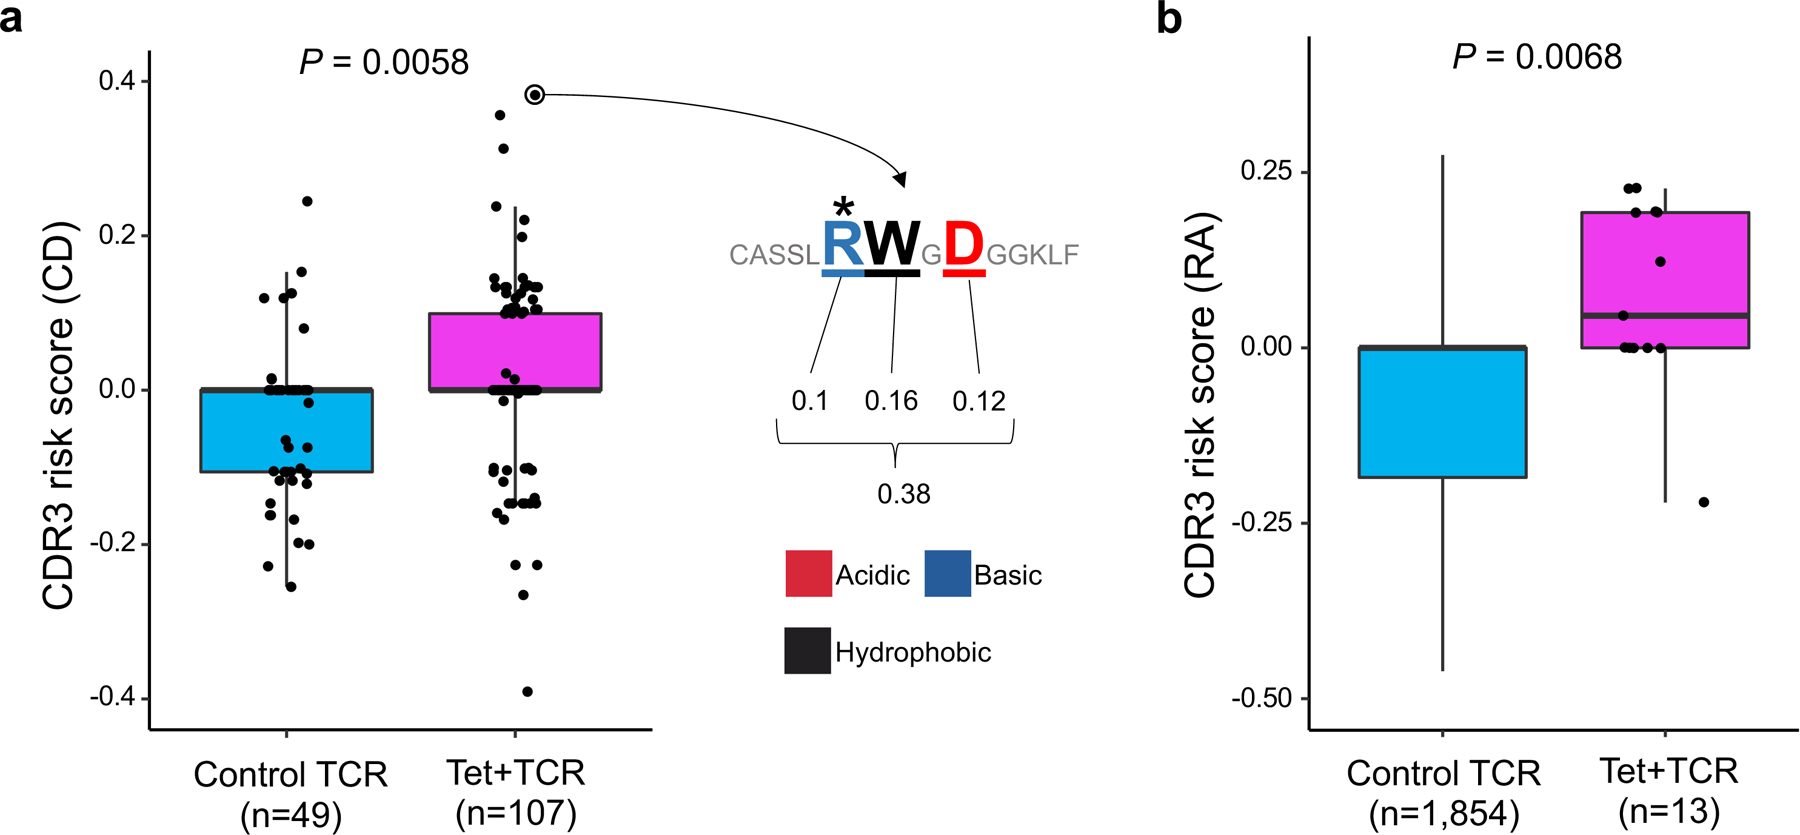
a, CD-CDR3 risk scores of TCRs reactive to gliadin epitopes and control TCRs. Seven TCRs specific to α-I gliadin (n = 4 patients), 92 TCRs specific to α-II gliadin (n = 13 patients), eight TCRs specific to ω-II gliadin (n = 2 patients), and 49 control TCRs (n = 3 patients) were analyzed. An illustration of CDR3 risk score calculation is provided for the CDR3 sequence with the highest score: effect sizes of CDR3 amino acids with a significant association to CD-HLA risk score (three amino acids of this sequence) are summed. Arginine (R) at position 109 (*) is known to be important for the recognition of α-II gliadin. One-sided t test P values are provided. b, RA-CDR3 risk scores of TCRs reactive to citrullinated epitopes and control TCRs. Six TCRs specific to citrullinated aggrecan (n = 5 patients), five TCRs specific to citrullinated CILP (n = 2 patients), one TCR specific to citrullinated vimentin (n = 1 patient), and one TCR specific to citrullinated enolase (n = 1 patient) were analyzed. We collected 1,753 control TCR sequences from an individual homozygous for HLA-DRB1*0401, the HLA-DRB1 allele with the highest risk for RA (Methods). One-sided t test P values are provided. Within each boxplot, the horizontal lines reflect the median, the top and bottom of each box reflect the interquartile range (IQR), and the whiskers reflect the maximum and minimum values within each grouping no further than 1.5 × IQR from the hinge.
We then analyzed TCR data from RA patients. The hallmark of RA is the immune reaction to citrullinated antigens. We sequenced six TCRs specific to citrullinated aggrecan (n = 5 patients), five TCRs specific to citrullinated cartilage intermediate layer protein (CILP) (n = 2 patients), one TCR specific to citrullinated vimentin (n = 1 patient), and one TCR specific to citrullinated enolase (n = 1 patient), which were identified by HLA-DRB1*04:01 or HLA-DRB1*04:04 tetramers (Supplementary Table 12). Since we did not have control TCR data from the same individuals, we prepared 1,753 control TCR sequences from an individual homozygous for HLA-DRB1*0401, the allele with the highest HLA-risk for RA (Methods). We observed that TCRs specific to citrullinated-epitopes had higher RA-CDR3 risk scores than control TCRs (one-sided t test P = 0.0068; Fig. 7b). Together, our analyses provide novel genetic evidence indicating that HLA autoimmune risk increases the frequency of TCRs reactive to candidate pathogenic antigens.
DISCUSSION
Our study demonstrated large effect size associations between HLA alleles and CDR3 amino acid compositions using a novel quantitative trait analysis framework for the TCR. We identified CDR3 amino acid patterns associated with MHC-wide risk for autoimmune diseases, which were enriched in T cells reactive to candidate pathogenic antigens. In future studies, CDR3 risk scoring can complement tetramer-based analyses by prioritizing pathogenic T cell populations solely based on TCR sequencing.
We would like to highlight three important points clarifying the novelty of our study. First and most importantly, we identified that the same HLA site (HLA-DRB1 site 13) substantially influences autoimmune risk and TCR-CDR3 amino acid composition. This specific site’s influence on CDR3 composition was not previously described. Second, our cdr3-QTL signals are independent of V gene usage and the presence of public clonotypes (Supplementary Note). Therefore, previous studies that only analyzed V genes or public clonotypes could not have detected these novel associations26,28,42,43. Third, our study demonstrates that HLA alleles influence specific amino acids at precise CDR3 positions. These HLA effects on individual TCR positions cannot be observed in clonotype- or V gene-level analyses that treat the entire TCR sequence as a single event26,28,42,43.
Cumulative evidence supports the peripheral hypothesis, where HLA risk alleles increase the affinity for pathogenic antigens7–9. Although our work provides novel genetic evidence to support the central hypothesis, these results by no means exclude the peripheral hypothesis. Rather, the combination of the central and the peripheral biology probably synergizes to drive autoimmunity risk.
Although our work provides various insights into HLA autoimmunity risk, we should address several limitations of this study. First, it is important to recognize that our investigation in the discovery dataset was limited to the TCR beta chain. Though the beta chain is more important for antigen-specificity27, future work is needed to assess whether there are also disease-relevant cdr3-QTLs affecting the TCR alpha chain. Second, because CD4+ T cells are nearly twice as prevalent as CD8+ T cells in peripheral blood, our analysis was better powered to detect class II HLA-CD4+ associations. Future studies in sorted CD8+ T cells will be necessary to resolve the relative contribution of MHC class I. Lastly, the number of antigen-specific TCRs was limited to currently available data. Advances in high-throughput experimental systems will likely expand the ability to detect disease-relevant antigens and their specific T cell populations in the near future44,45. We anticipate that this will expand our knowledge of pathogenic TCR patterns and will further clarify the role of the central hypothesis.
It is now clear that HLA risk alleles modulate the process of thymic selection and give rise to TCR repertoires that may be poised for autoreactivity. This finding reinvigorates a role for the central hypothesis in mediating inter-individual differences in autoimmune disease risk.
METHODS
TCR-CDR3 sequencing data.
We downloaded the discovery dataset from the Adaptive Biotechnologies immuneACCESS site (https://clients.adaptivebiotech.com/pub/emerson-2017-natgen). The discovery dataset has CDR3 sequences of TCR beta chains from peripheral blood of healthy individuals (n = 666). This dataset has 242,461 unique CDR3 sequences per individual on average (Table 1). For the main analysis, we included the 628 individuals whose four-digit classical alleles were available for all of HLA-A, HLA-B, HLA-C, HLA-DQB1, and HLA-DRB1. As for the demographic data, age was available for 555 samples, sex was available for 642 samples, and ancestry data was available for 414 samples (detailed information is provided in Table 1). We defined amino acid sequences with stop codons or frameshifts as non-productive amino acid sequences. We used productive amino acid sequences of CDR3 and V/J gene information as reported in the original data. For amino acids of non-productive CDR3 sequences, we used MIXCR software (v2.1.11; with default parameters) since the original data did not report these sequences. For the primary analysis, we treated each unique TCR sequence as a single event irrespective of read depth to exclude the influence of clonal expansion. We considered the read depth of each TCR sequence as a weight to calculate amino acid frequencies only when specifically discussing the effect of clonal expansion. We restricted our analysis to TCR sequences whose CDR3 has a length between 12 and 18 amino acids, which covers 94.1% of data (Extended Data Fig. 1). We aligned CDR3 amino acids to position 104 to 118 defined by IMGT (http://imgt.org/); CDR3 with length 12–14 have gaps in the middle and CDR3 with length 16–18 have extra positions in the middle (Extended Data Fig. 1).
HLA genotypes.
We downloaded genotype data for the discovery dataset from the Adaptive Biotechnologies immuneACCESS site (https://clients.adaptivebiotech.com/pub/emerson-2017-natgen). Genome-wide genotyping data was not available for the discovery dataset; it was restricted to four-digit classical alleles of HLA genes. The number of samples with genotype data is different across HLA genes: HLA-A (n = 629), HLA-B (n = 630), HLA-C (n = 629), HLA-DPA1 (n = 606), HLA-DPB1 (n = 472), HLA-DQA1 (n = 522), HLA-DQB1 (n = 630), HLA-DRB1 (n = 630). Using the amino acid sequence data of classical alleles reported in IMGT (http://imgt.org/), we identified amino acid alleles at each site of the HLA genes; our strategy is illustrated in Supplementary Figure 18. We provide the mean and variance of HLA amino acid allele counts in Supplementary Table 13. For multi-allelic amino acid positions, we defined composite markers which consist of all possible combinations of alleles in addition to each individual allele as reported in our previous studies1,2. Since there were many missing data for HLA-DPA1, HLA-DPB1, and HLA-DQA1, we restricted our main analysis to the 628 samples whose four-digit classical alleles were available for all of HLA-A, HLA-B, HLA-C, HLA-DQB1, and HLA-DRB1, and we conducted principal component analysis (PCA) using genotypes for these five HLA genes. The PCA is based on four-digit classical alleles, and we excluded correlated alleles before conducting PCA (r2 > 0.5).
cdr3-QTL analysis.
We treated the amino acid composition of CDR3 as a quantitative trait and tested its association with HLA genotypes. The observed variation in amino acid frequencies for each of these 70 CDR3 positions is provided in Supplementary Table 14. To avoid confusion, we refer to an amino acid position of HLA as a “site” and that of CDR3 as “position”. We analyzed each amino acid position of each length of CDR3 separately (length 12–18 amino acids). We did not analyze multiple positions simultaneously (i.e. we did not analyze multimers or motifs in CDR3). We excluded germline-encoded amino acids from each of the individual CDR3 sequences in our main analysis (Supplementary Note and Supplementary Fig. 3). We excluded rare CDR3 amino acids that were observed less than 50% of individuals in a given position and length of CDR3. We also excluded rare genotypes that have a minor allele frequency (MAF) less than 1%. We conducted cdr3-QTL analysis using three different models as follows (Fig. 1b and Extended Data Fig. 2).
Multivariate multiple linear regression model (MMLM).
This model was used to quantify the correlation between the frequencies of all amino acids at a CDR3 position and the allele counts of all amino acid alleles at an HLA site. We calculated the proportion of unique CDR3 sequences that had each amino acid residue at a given position of CDR3, and we used this information to create a multi-dimensional phenotype vector to represent all amino acids at that position. For each component of this phenotype vector, proportions were transformed into a standard normal distribution across individuals (rank-based). At a given HLA site with m possible amino acid residues, we partitioned the classical alleles into m groups, each with identical residues at the given site. We then calculated the allele count of each group (Supplementary Fig. 18). We included the top three principal components of genotypes in this analysis. As a result, the full model is the following multivariate multiple linear regression model:
Where Yi indicates the n-dimensional phenotype vector of individual i (assuming there are n possible amino acids at that CDR3 position), a indicates a specific group of classical alleles being tested, and ga,i is the allele count of allele group a in individual i. In the replication dataset, we used the estimated allele dosage instead of the allele count since genotype data was imputed. is an n-dimensional parameter that represents the additive effect per allele. We included m – 1 groups of classical alleles, casting 1 group as the reference. is an n-dimensional parameter that represents the effect of the k-th principal component, and is the value for individual i for the k-th principal component. θ is an n-dimensional parameter that represents the intercept.
The null model only had terms for covariates without allelic effects:
We estimated the improvement in model fit between the full model and the null model using MANOVA and assessed the significance of the improvement using Pillai statistics. The inter-individual variance in the n-dimensional phenotype vector explained by m – 1 genotype groups was estimated using R package MVLM. We calculated the variance explained by full and null models separately, and we defined the variance explained by genotypes as the difference between the two values. Although we conducted separate association tests for each CDR3 length, we provided the largest variance explained across all CDR3 lengths for each HLA site-CDR3 position pair when we prepared summary figures to provide concise results (e.g., Fig. 2). In null datasets with permuted sample labels, the variance explained was minimal, and the MANOVA P values were well calibrated (Extended Data Fig. 3).
Linear regression model (LM).
This model was used to quantify the correlation between a particular amino acid frequency at a CDR3 position and the allele count of a particular amino acid allele at an HLA site. We used the same phenotypes as used in the multivariate multiple linear regression model (but a single value phenotype in this model rather than an n-dimensional vector). We used only the count of a particular amino acid allele for each model, comparing that allele to all other alleles.
We used the following linear regression model:
where yi indicates a scalar phenotype of individual i, a indicates a specific HLA allele being tested, and is the allele count of allele a in individual i. is a scalar parameter that represents the additive effect per allele a. is a scalar parameter that represents the effect of the k-th principal component, and is the value for individual i for the k-th principal component. θ is a scalar parameter that represents the intercept.
Linear mixed regression model (LMM).
This model is similar to the linear regression model, but TCRs within each donor are grouped by V gene (or J gene) for CDR3 amino acid frequency calculations (Extended Data Fig. 2). We include a fixed effect term for the expressed V gene (or J gene) and a random effect term for the individual:
where represents the effect of V gene b, and is an indicator variable that is equal to 1 only if the CDR3 has V gene b. Similarly, represents the effect of J gene d, and is an indicator variable that is equal to 1 only if the CDR3 has J gene d. Since grouping TCRs by V gene (or J gene) creates multiple observations from each individual, we include a random effect term for the individual to control for repeated measurements. The definition of the other terms is the same as those in the linear regression model. We used R package lme4. Since the purpose of this model is to estimate V and J gene biases in the strong signals from the LM analysis (the primary analysis), we restricted this analysis to 388 CDR3 phenotypes (CDR3 length, position, amino acid combinations) that had at least one significant association in the LM analysis (P < 0.05/1,249,742 all tests) and used the HLA amino acid allele that had the lowest P value for each phenotype.
HLA gene-level conditional analysis.
To test for independent cdr3-QTL signals outside of a given HLA gene, we conducted a conditional analysis using a multivariate multiple linear regression model and controlling all effects coming from that HLA gene. The strongest cdr3-QTL signal was found within the HLA-DRB1 locus. Therefore, in the first round of the conditional analysis, we conducted cdr3-QTL analysis using all four-digit classical HLA-DRB1 alleles as covariates. In this analysis, the strongest signal was found within the HLA-B locus. Therefore, in the second round of the conditional analysis, we conducted cdr3-QTL analysis using all four-digit classical alleles of HLA-DRB1 and HLA-B as covariates. We repeated this process iteratively until we did not observe further significant signal (P > 0.05/24,430). We excluded strongly correlated alleles among covariates (r2 > 0.8).
HLA site-level conditional analysis.
To test for independent cdr3-QTL signals within a given HLA gene, we conducted a conditional haplotype analysis using a multivariate multiple linear regression model and controlling all effects coming from specific sites of that HLA gene. The strongest cdr3-QTL signal was found at site 13 of HLA-DRB1. Therefore, in the first round of the conditional analysis, we conducted cdr3-QTL analysis by controlling the effects coming from site 13. The null model consisted of haplotypes defined only by alleles at site 13. The full model consisted of haplotypes defined by the combination of alleles at site 13 and the target site; addition of the target site may result in k additional unique haplotypes if the site is independent from site 13. We tested whether the creation of k additional haplotype groups improved the model fit. In this analysis, the strongest signal was found within site 71 of HLA-DRB1. Therefore, in the second round of the conditional analysis, we conducted cdr3-QTL analysis by controlling the effects coming from site 13 and 71. We repeated this process iteratively within HLA-DRB1 until we did not observe further significant signal (P > 0.05/24,430).
Structural analysis of MHC-peptide-TCR complex.
We downloaded the structural analysis results of MHC-peptide-TCR complexes from Protein Data Bank (https://www.rcsb.org/). We restricted our analysis to results for HLA-DRB1 that had all positional data for all three molecules: the HLA proteins, the antigenic peptide, and the TCR beta chain. These are Protein Data Bank entries 1J8H, 1YMM, 2IAM, 2IAN, and 4E41. For each amino acid, we first calculated the centroids of every atom using the XYZ orthogonal Å coordinates reported in the database, and we next calculated the pairwise distances between amino acids using the centroid positions.
We calculated pairwise distances between HLA, TCR, and antigenic peptide amino acids and embedded them into a two-dimensional space. In this embedding, we preserved distances important for antigen recognition (distances between HLA-DRB1 and antigens and those between TCR and antigens), and down-weighted the distances between HLA-DRB1 and TCR (Supplementary Note).
We then visualized the HLA-DRB1 amino acid sites that had independently significant associations in the conditional haplotype analyses. We used UCSF Chimera software to create a 3-D view of the MHC-peptide-TCR complex based on Protein Data Bank entries 2IAM.
Replication analysis using naïve CD4+ T cells.
The replication dataset was generated by the BLUEPRINT consortium and was downloaded from European Genome-phenome Archive under the accession codes EGAD00001002671 and EGAD00001002663 (https://www.ebi.ac.uk/ega/home). We analyzed FASTQ files of RNA sequencing data of naïve CD4+ T cells (n = 169 healthy donors). Demographic data are provided in Table 1. Reads were mapped to GRCh38 human reference sequences with GENCODE v26 gene models by STAR software (v2.5.3). Using reads mapped to the TCR loci (chr7: 142,299,011–142,813,287 for beta chain) and unmapped reads, we analyzed TCR sequences using MIXCR (v2.1.11; with default parameters). Using genotype data around the MHC locus, we imputed HLA genotypes by SNP2HLA software using the T1DGC reference panel (n = 5,225 European samples) and excluded poor quality genotypes (r2 < 0.5). We conducted PCA by PLINK software (v1.90) using LD-pruned genome-wide variants (r2 > 0.2).
HLA risk score.
To evaluate MHC-wide risk of RA, T1D, and CD for each individual, we defined an HLA risk score for each disease. First, we defined critical haplotypes of HLA alleles that confer disease risk based on the results of previous studies1,2,29 (Supplementary Table 8). For RA, we included four amino acid sites: HLA-DRB1 sites 11, 13, 71, and 74. For T1D, we included three amino acid sites: HLA-DQB1 site 57, and HLA-DRB1 sites 13 and 71. For CD, we included four-digit classical alleles of HLA-DRB1 and HLA-DQB1. Since many samples did not have HLA-DQA1 genotypes (n = 144), we did not include the genotype of HLA-DQA1. We used the odds ratio of each haplotype according to multivariate regression as reported in previous GWAS (Supplementary Table 8). We then calculated the product of effect sizes (= log(odds ratio)) and the count of those haplotypes in each individual, and the sum of two products was defined as HLA risk score of that individual. The HLA risk score has a different distribution for each disease. When we conducted regression using HLA risk score, we scaled the HLA risk scores to have a s.d. equal to 1. Effect sizes for HLA risk scores of different diseases are therefore comparable to each other.
Amino acid features.
Amino acids have multiple complex physiochemical and biological properties. To analyze amino acid features comprehensively, we used five previously reported numeric features that summarize the entire constellation of amino acid physiochemical properties (each amino acid has a unique value for each feature)35. Briefly, these five features were derived from factor analysis based on 494 amino acid indices, which include general attributes (e.g., molecular volume) as well as more specific measures (e.g., side chain orientation angle). Based on the original report, we annotated factor I as charge, factor II as hydrophobicity, factor III as refractivity, factor IV as propensity for secondary structure, and factor V as molecular size. For factor II, the original value indicated hydrophilicity, and we flipped the sign so that the value represents hydrophobicity. When we conducted cdr3-QTL analysis using these amino acid features, we calculated the weighted average of a given amino acid feature (we multiplied the frequency of each amino acid by its value for a given feature and calculated the sum of the product). When we conducted cdr3-QTL analysis for a given feature, we added the other four features as covariates to handle correlations between these features.
CDR3 risk score.
We developed a scoring system that indicates the extent of each CDR3 sequence’s association with HLA risk score, and we refer to this as CDR3 risk score. This is analogous to polygenic risk score (PRS). We used effect sizes of HLA risk score on each amino acid residue in each position of CDR3 with each length (L12–18) from a linear regression model (i.e., effect sizes of cdr3-QTL analysis based on HLA risk score). The risk score is the sum of effect sizes of amino acids in a given CDR3 sequence (Supplementary Fig. 17).
As in PRS, the P-value threshold in cdr3-QTL analysis is an important tuning parameter for CDR3 risk score. Therefore, we determined an appropriate P-value threshold with five-fold cross validation in the discovery dataset (Supplementary Note). In each round of cross validation, we conducted cdr3-QTL analysis based on HLA risk score using 80% of samples, and we used the effect sizes from this analysis to calculate CDR3 risk score in the testing samples (the remaining 20% of samples). The CDR3 risk score is expected to be correlated with HLA risk score based on its definition. Therefore, we evaluated the performance of CDR3 risk score by using its correlation with HLA risk score. Using RA-CDR3 risk score, we confirmed that the Bonferroni-corrected P value (= 0.05/1,368) provided the best performance (Supplementary Fig. 17). Therefore, for the main analysis of the CDR3 risk score, we included the 83, 187, and 119 CDR3 phenotypes (length-position-amino acid combinations) for RA, T1D, and CD, respectively, that passed the Bonferroni-corrected P-value threshold (P < 0.05/1,368).
TCR sequences of tetramer-positive T cells.
We analyzed TCR sequences that were reactive to candidate pathogenic epitopes for RA and CD. We restricted our analyses to CDR3s with a length between 12 and 18 amino acids, and calculated CDR3 risk scores for RA and CD. We used one-sided t test to assess the significance of the difference in CDR3 risk scores between the two groups.
For the RA analysis, we collected peripheral blood of RA patients (n = 7 in total; Supplementary Table 12) and expanded T cells using peptides corresponding to relevant citrullinated epitopes46,47. We conducted fluorescence-activated cell sorting (FACS) using HLA-DRB1*0401- or HLA-DRB1*0404-tetramer loaded with citrullinated aggrecan (cit-aggrecan), citrullinated CILP (cit-CILP), citrullinated vimentin (cit-vimentin), or citrullinated enolase (cit-enolase), isolating and expanding single cells and then sequencing the TCRs of these T cells48. We thus identified six cit-aggrecan-specific TCR sequences from five RA patients, five cit-CILP-specific TCR sequences from two RA patients, one cit-vimentin-specific TCR from one RA patient, and cit-enolase-specific TCR from one RA patient. Patients in this analysis had at least one allele of HLA-DRB1*0401 or HLA-DRB1*0404, though their HLA genotypes were not necessarily identical (Supplementary Table 12). Since we did not have control TCR sequences from the same patients, we utilized TCR sequences from the replication dataset (naïve CD4+ T cells in peripheral blood of healthy individuals). We restricted the samples in the replication dataset to individuals who were homozygous for HLA-DRB1*0401 (the allele with the highest HLA risk score). Since CDR3 risk score is positively correlated with HLA risk score by definition, this strategy should identify individuals who have TCR repertoires with the highest CDR3 risk scores; hence, this strategy is a conservative approach. One individual with 1,753 TCR sequences met this criterion.
For the CD analysis, we searched the literature for studies that utilized tetramers to identify gliadin epitope-specific CD4+ T cells and reported their sequences. Three studies met these criteria36–38, and included seven TCRs specific to α-I gliadin (n = 4 patients), 92 TCRs specific to α-II gliadin (n = 13 patients), eight TCRs specific to ω-II gliadin (n = 2 patients), and 49 control TCRs (n = 3 patients). Patients in these reports had at least one HLA-DQ2 haplotype (HLA-DQA1*05:01-HLA-DQB1*02:01), though their HLA genotypes were not necessarily identical.
Extended Data
Extended Data Fig. 1. TCR structure in the discovery dataset.
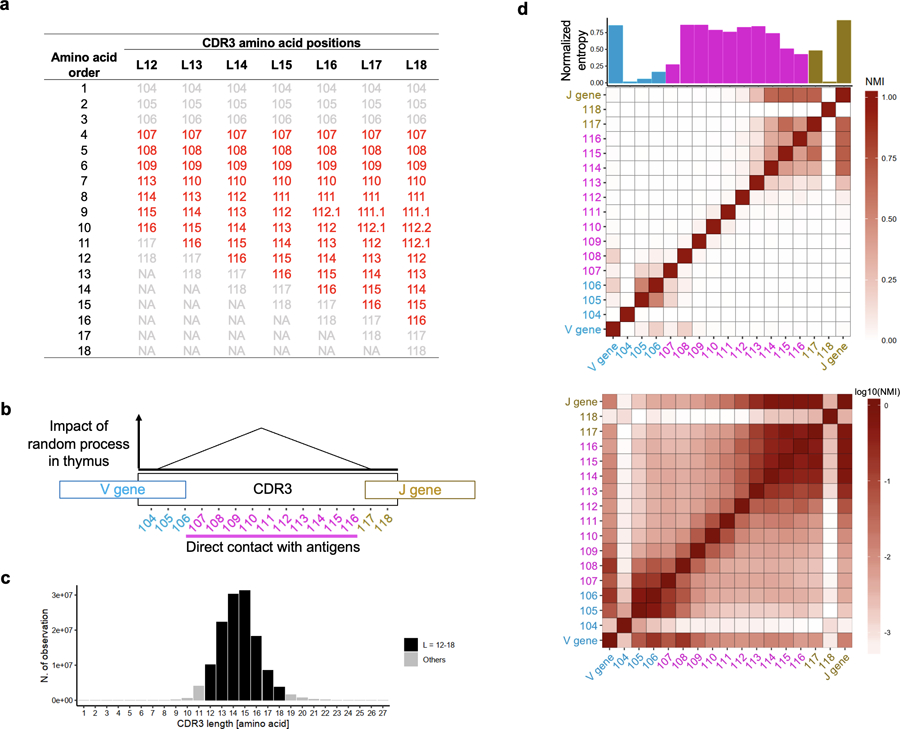
a, The amino acid positioning scheme used in this study. Additional amino acids in longer CDR3s align to middle positions. b, Schematic explanation of the structure of CDR3. During T cell development in thymus, TCRs are generated by randomly recombining component genes (V, D, and J gene for beta chain). In addition, several nucleotides are randomly added or deleted at the junctional regions. c, The distribution of CDR3 amino acid length in the discovery dataset. d, The diversity and mutual information of amino acid composition at CDR3 positions (length = 15 amino acids). Normalized entropy (bar plot) and normalized mutual information (NMI, heatmap) of amino acid usage at each position of CDR3 and V/J gene usage were calculated in each individual, and the averaged values are provided. In the top heatmap, NMI is shown in a linear scale. In the bottom heatmap, NMI is shown in log scale.
CDR3 positions 107–116, which directly contact antigenic peptides, are highlighted in red (b and d).
Extended Data Fig. 2. Statistical models used in this study.
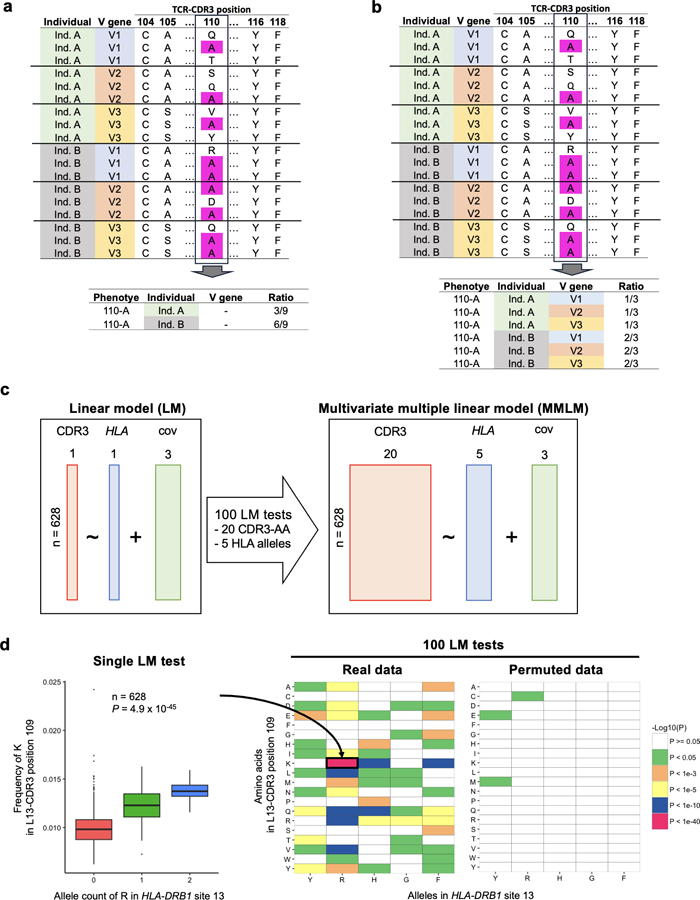
a, Strategy to calculate amino acid frequencies in the main analysis. In this example, the alanine (A) usage ratio at CDR3 position 110 is calculated for each individual. b, Strategy to calculate amino acid frequencies for the linear mixed model (LMM) used to adjust the effect of V genes. In this example, alanine (A) usage ratio at CDR3 position 110 was calculated for each individual for each V gene. c, Schematic explanation of LM and MMLM, the two main linear models in this study. Each square indicates the dimensions of the matrix. In LM, the frequency of a single amino acid at a position of CDR3 is the response variable; the count of a single amino acid allele at a site of HLA is the explanatory variable. In MMLM, a vector of frequency of all amino acids at a given position of CDR3 is the response variable; the counts of all amino acid alleles except one at the HLA site are the explanatory variables. When we have 20 CDR3 phenotypes and the five HLA alleles, we need to conduct 100 LM tests to cover all combinations (as shown in d). On the other hand, MMLM model aggregates all 100 combinations into one single association test, maximizing the power of detecting associations. cov, covariates. d, On the left, we provide an association plot between the allele count of arginine (R) in HLA-DRB1 site 13 and the frequency of lysine (K) in position 109 of L13-CDR3. The P value from the LM analysis is provided (n = 628 donors; two-sided linear regression test). On the right, we provide a heatmap showing P values from all 100 LM tests. We also provide a heatmap showing the P values from a permuted dataset. Within each boxplot, the horizontal lines reflect the median, the top and bottom of each box reflect the interquartile range (IQR), and the whiskers reflect the maximum and minimum values within each grouping no further than 1.5 × IQR from the hinge.
Extended Data Fig. 3. Permutation analyses using the MMLM.
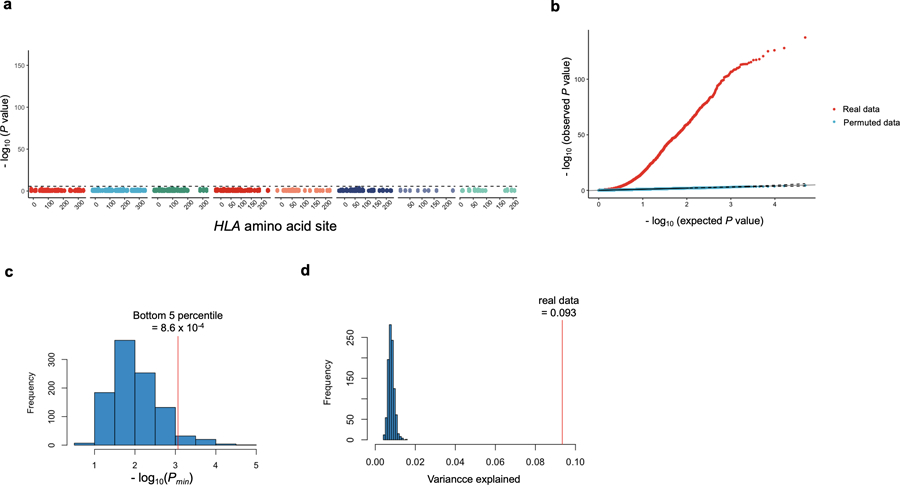
a, MANOVA test P values in cdr3-QTL analysis using the MMLM with permuted sample labels (n = 628; the discovery dataset). At each HLA site, P values of all CDR3 phenotypes are plotted. The black dashed line corresponds to the Bonferroni P value threshold (P = 0.05/24,360 total tests). b, QQ plots of MANOVA test P values in cdr3-QTL analysis using the MMLM with the real and the permuted sample labels (n = 628). Both have 24,360 data points. c, The distribution of minimum P values (Pmin) using the MMLM in each round of the 1,000 permutations (MANOVA test). We restricted this analysis to alleles at HLA-DRB1 site 13. In each round of permutation, we tested associations for all CDR3 positions (70 length-position combinations). The bottom 5 percentile of Pmin was 8.6 × 10⁻⁴, almost identical to the Bonferroni P value threshold (= 0.05/70 total tests = 7.1 × 10⁻⁴), which indicates that our P values are well calibrated. d, The distribution of variance in amino acid composition at position 109 of L13-CDR3 explained by the alleles at HLA-DRB1 site 13 in each round of the 1,000 permutations. Red vertical line denotes the observed variance explained in unpermuted data.
Extended Data Fig. 4.
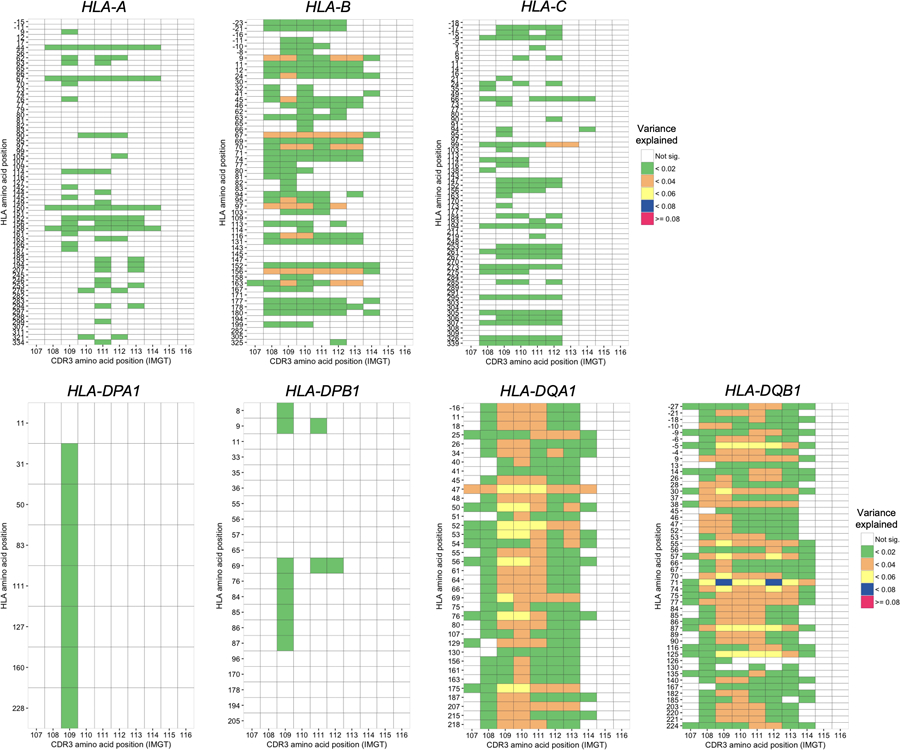
Variance explained in the MMLM analysis summarized across different lengths of CDR3. Variance explained in the MMLM analysis (n = 628; the discovery dataset). The results for all HLA genes except HLA-DRB1 are provided. For each HLA site-CDR3 position pair, the largest variance explained across different CDR3 lengths is shown in a heatmap.
Extended Data Fig. 5. MMLM and LM results in the replication dataset.
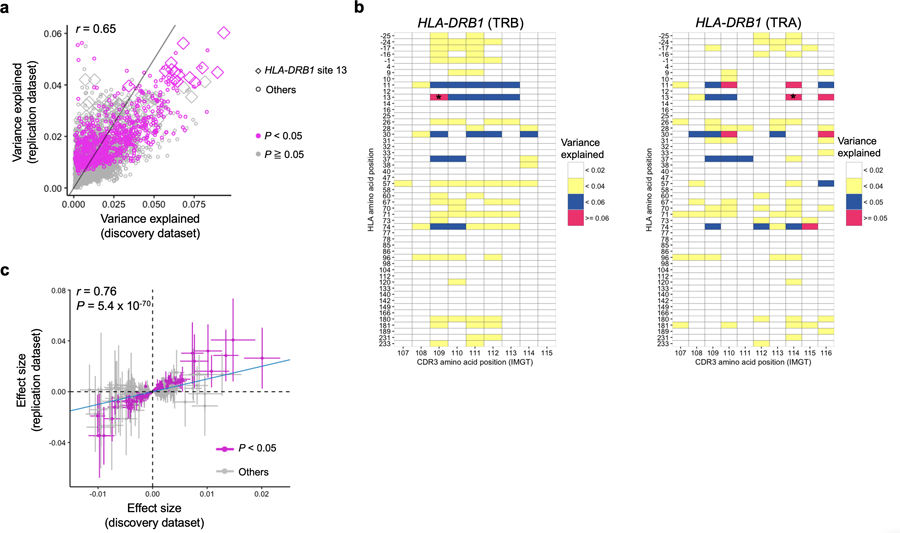
a, Explained variance in the MMLM analysis in the discovery dataset (n = 628; peripheral blood) compared with that in the replication dataset (n=169; naïve CD4+ T cells). All pairs of class II HLA sites and CDR3 phenotypes are shown without any filtering (9,735 data points). The results at HLA-DRB1 site 13 and the results with P < 0.05 in the replication dataset are highlighted. b, Explained variance in the MMLM analysis in the replication dataset (n = 169; naïve CD4+ T cells). For each HLA site-CDR3 position pair, the largest variance explained across different CDR3 lengths are shown in a heatmap. The results of HLA-DRB1 are provided. Only associations with P < 0.05 are colored in the heatmap. The results both for alpha and beta chains are provided. The pair with the largest variance is indicated by an asterisk. c, LM analysis using the replication dataset (n = 169; naïve CD4+ T cells). Effect sizes for non-transformed phenotypes from discovery and replication datasets are provided. The error bar indicates ± 2 × s.e. The nominally significant associations in the replication dataset are highlighted in red (P < 0.05). The analysis was restricted to the 388 CDR3 phenotypes (length-position-amino acid combinations) that had at least one significant association in the LM analysis (P < 0.05/1,249,742 total tests) and were testable in the replication dataset. For each CDR3 phenotype, we used the HLA amino acid allele that had the lowest P value for that phenotype in the LM analysis of the discovery dataset. We used P values from two-sided linear regression test.
Extended Data Fig. 6. Six sites in HLA-DRB1 have independently significant cdr3-QTL effects.
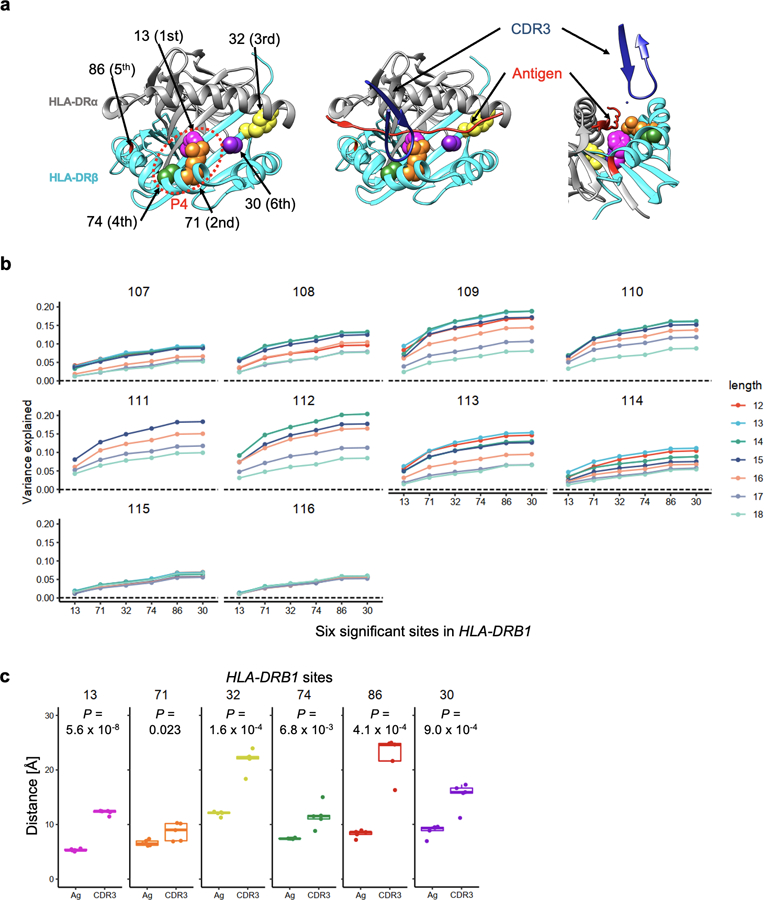
a, Structure of HLA-DRB1 protein and amino acid sites with independently significant cdr3-QTL effects (Protein database 2IAM). Positions 13, 71 and 74 are within the P4 binding pocket. On the left, we depict only HLA-DR molecules looking into the binding groove. In the middle, we depict the antigen (red) and CDR3 (dark blue) overlaid onto HLA-DR molecules. On the right, we depict HLA-DR, antigen, and CDR3 from a side view. b, Variance explained by six HLA-DRB1 amino acid sites with independently significant cdr3-QTL effects (n = 628; MMLM; the discovery dataset). The order of sites on the x-axis indicates the order of significance. c, The distances from HLA-DRB1 amino acid sites to antigen (Ag) or to CDR3. We analyzed five structures and the shortest distances in each structure were used. One-sided paired t test P values are provided (n = 5). Within each boxplot, the horizontal lines reflect the median, the top and bottom of each box reflect the interquartile range (IQR), and the whiskers reflect the maximum and minimum values within each grouping no further than 1.5 × IQR from the hinge.
Extended Data Fig. 7.
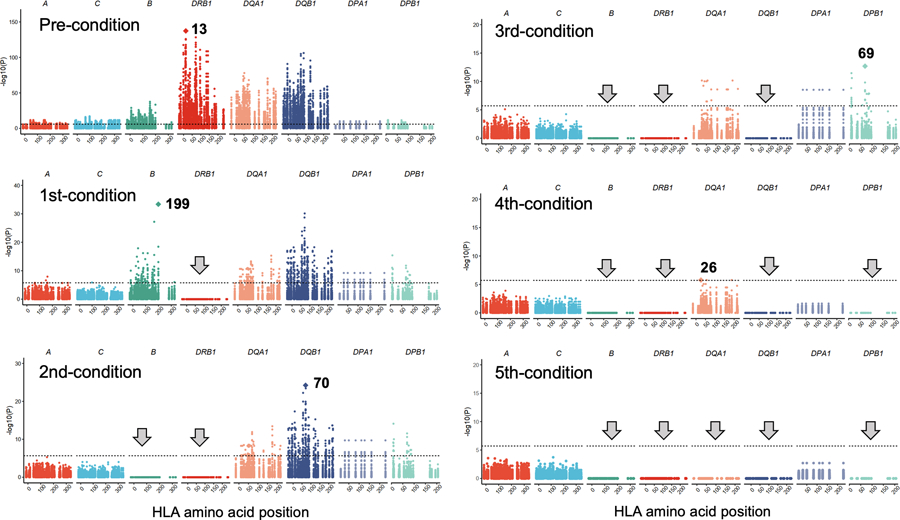
Conditional analysis using four-digit classical alleles. Conditional analysis using four-digit classical alleles (n = 628; MMLM; the discovery dataset). In the first conditioning analysis, to assess whether there were independent effects outside of the HLA-DRB1 locus, we conducted cdr3-QTL analysis using all four-digit classical alleles of HLA-DRB1 as covariates, and the strongest signal was found in HLA-B region. In the second conditional analysis, we additionally included all four-digit classical alleles of HLA-B as covariates. We sequentially included as covariates all four-digit classical alleles of the gene with the strongest signal until we did not observe further significant signal (P > 0.05/24,360 total tests). We excluded strongly correlated alleles among covariates (r2 > 0.8). We reported MANOVA test P values.
Extended Data Fig. 8.
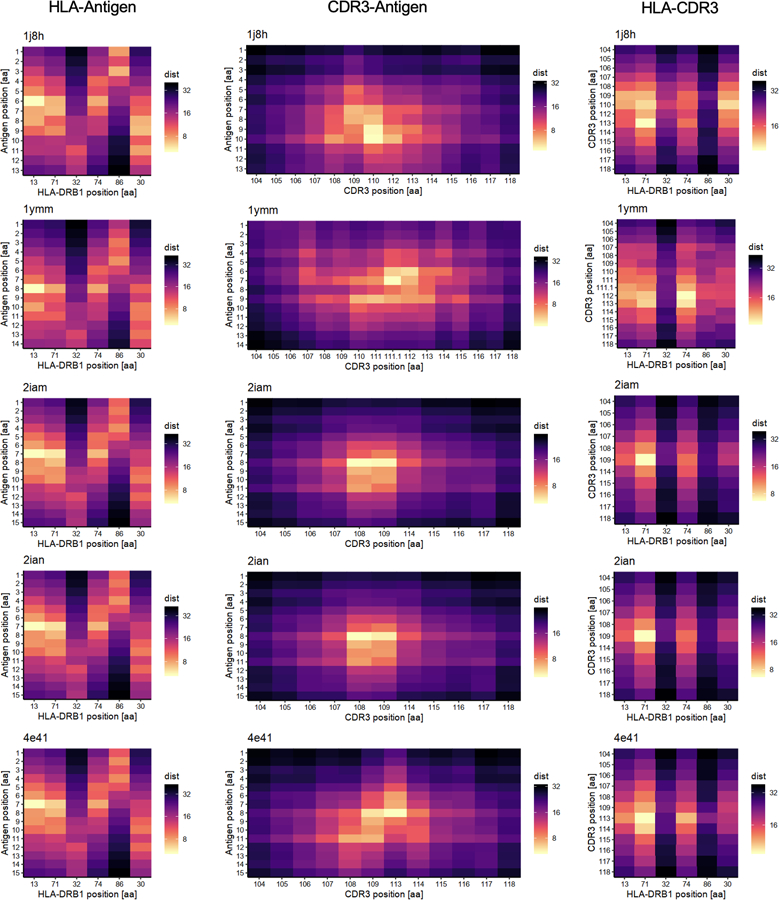
The pair-wise distances of amino acids in MHC-peptide-TCR complexes. The distances (in Å) between HLA-DRB1 sites and antigen (left), CDR3 amino acids of beta chains and antigen (middle), and HLA-DRB1 sites and CDR3 amino acids of beta chains (right) are shown in heatmaps.
Extended Data Fig. 9.
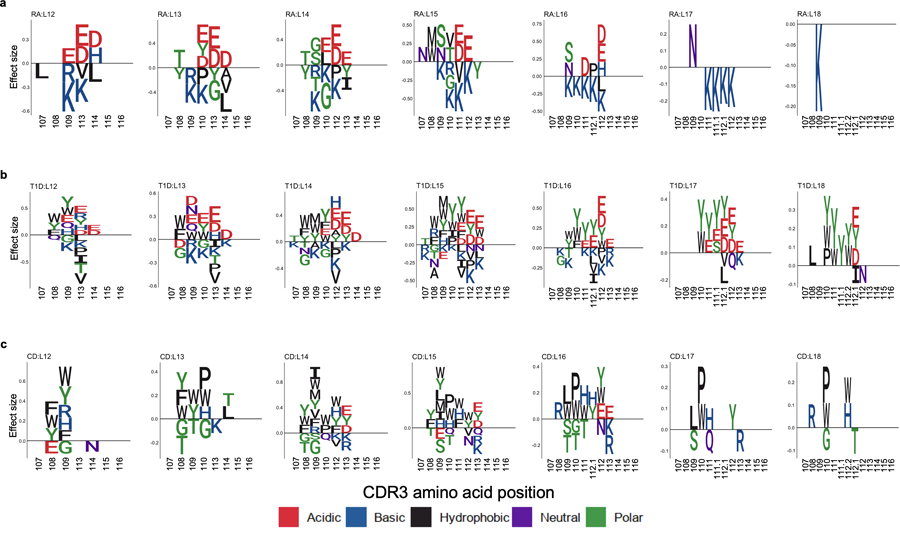
CDR3 amino acids associated with MHC-wide risk of RA, T1D, and CD. CDR3 amino acids influenced by HLA risk score. We conducted the LM analysis using HLA risk score; the CDR3 phenotypes were each amino acid at each position of each length of CDR3 (n = 628; the discovery dataset). a-c, The effect sizes of significant associations for each amino acid at a given position are illustrated by sequence logo (P < 0.05/1,354 total test), separately for different CDR3 lengths (a, RA; b, T1D; and c, CD). We used P values from two-sided linear regression test.
Extended Data Fig. 10.
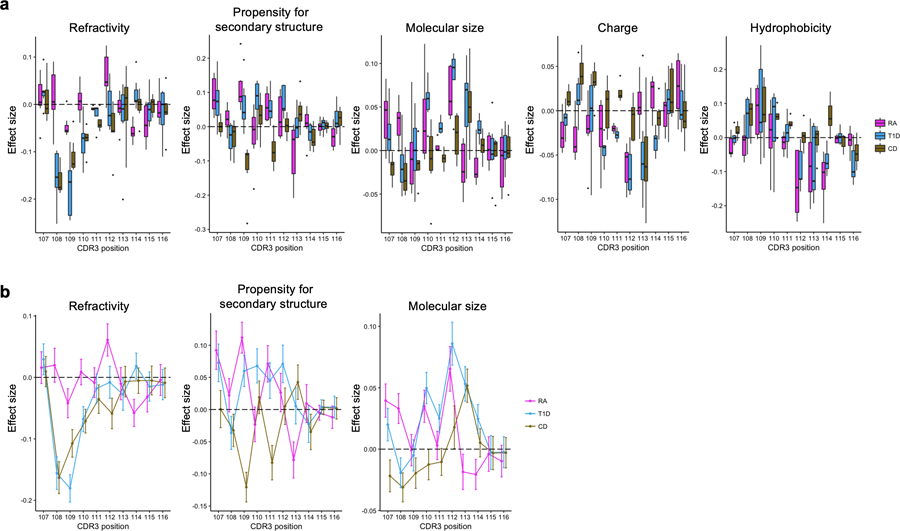
Amino acid features at each position of CDR3 influenced by HLA risk score. We conducted the LM analysis using HLA risk score in which the phenotypes were amino acid features at a given position of each length of CDR3 (n = 628; the discovery dataset). a, Effect sizes were plotted separately for different lengths of CDR3. Within each boxplot, the horizontal lines reflect the median, the top and bottom of each box reflect the interquartile range (IQR), and the whiskers reflect the maximum and minimum values within each grouping no further than 1.5 x IQR from the hinge. b, Meta-analyzed effect sizes were plotted (the results for charge and hydrophobicity are shown in Fig. 6c). The error bar indicates ± 2 × s.e.
Supplementary Material
ACKNOWLEDGEMENTS
This work was supported in part by funding from the National Institutes of Health (1-U01-HG012009 (S.R.). AR063759–05 (S.R.), U01-HG009379–04 (S.R.), U19-AI111224–06 (S.R.), T32GM007753 (K.L.)). K.I. was supported by The Uehara Memorial Foundation. We also acknowledge Michael Brenner, A. Helena Jonsson, and Deepak Rao for helpful feedback.
Footnotes
COMPETING INTERESTS
The authors declare no competing interests.
Code availability
All code used in this study is available at our website (https://github.com/immunogenomics/cdr3-QTL) and deposited at Zenodo (https://zenodo.org/badge/latestdoi/306212645).
Data availability
All raw TCR sequence data and genotype data of the discovery dataset and the replication dataset are available at Adaptive Biotechnologies immuneACCESS site (https://clients.adaptivebiotech.com/pub/emerson-2017-natgen) and European Genome-phenome Archive under the accession code of EGAD00001002671 and EGAD00001002663 (https://www.ebi.ac.uk/ega/home). All summary statistics of cdr3-QTL analysis are available at our website (https://github.com/immunogenomics/cdr3-QTL).
REFERENCES
- 1.Raychaudhuri S et al. Five amino acids in three HLA proteins explain most of the association between MHC and seropositive rheumatoid arthritis. Nat. Genet 44, 291–296 (2012). [DOI] [PMC free article] [PubMed] [Google Scholar]
- 2.Hu X et al. Additive and interaction effects at three amino acid positions in HLA-DQ and HLA-DR molecules drive type 1 diabetes risk. Nat. Genet 47, 898–905 (2015). [DOI] [PMC free article] [PubMed] [Google Scholar]
- 3.Okada Y et al. Genetics of rheumatoid arthritis contributes to biology and drug discovery. Nature 506, 376–381 (2014). [DOI] [PMC free article] [PubMed] [Google Scholar]
- 4.Lenz TL et al. Widespread non-additive and interaction effects within HLA loci modulate the risk of autoimmune diseases. Nat. Genet 47, 1085–1090 (2015). [DOI] [PMC free article] [PubMed] [Google Scholar]
- 5.Gutierrez-Achury J et al. Fine mapping in the MHC region accounts for 18% additional genetic risk for celiac disease. Nat. Genet 47, 577–578 (2015). [DOI] [PMC free article] [PubMed] [Google Scholar]
- 6.Stahl EA et al. Genome-wide association study meta-analysis identifies seven new rheumatoid arthritis risk loci. Nat. Genet 42, 508–514 (2010). [DOI] [PMC free article] [PubMed] [Google Scholar]
- 7.Gebe JA, Swanson E & Kwok WW HLA Class II peptide-binding and autoimmunity. Tissue Antigens 59, 78–87 (2002). [DOI] [PubMed] [Google Scholar]
- 8.Busch R, Kollnberger S & Mellins ED HLA associations in inflammatory arthritis: emerging mechanisms and clinical implications. Nat. Rev. Rheumatol 15, 364–381 (2019). [DOI] [PubMed] [Google Scholar]
- 9.Koning F, Thomas R, Rossjohn J & Toes RE Coeliac disease and rheumatoid arthritis: Similar mechanisms, different antigens. Nat. Rev. Rheumatol 11, 450–461 (2015). [DOI] [PubMed] [Google Scholar]
- 10.Scally SW et al. A molecular basis for the association of the HLA-DRB1 locus, citrullination, and rheumatoid arthritis. J. Exp. Med 210, 2569–2582 (2013). [DOI] [PMC free article] [PubMed] [Google Scholar]
- 11.Ting YT et al. The interplay between citrullination and HLA-DRB1 polymorphism in shaping peptide binding hierarchies in rheumatoid arthritis. J. Biol. Chem 293, 3236–3251 (2018). [DOI] [PMC free article] [PubMed] [Google Scholar]
- 12.Kwok WW, Domeier ML, Raymond FC, Byers P & Nepom GT Allele-specific motifs characterize HLA-DQ interactions with a diabetes-associated peptide derived from glutamic acid decarboxylase. J. Immunol 156, (1996). [PubMed] [Google Scholar]
- 13.Jabri B & Sollid LM T cells in celiac disease. J. Immunol 198, 3005–3014 (2017). [DOI] [PMC free article] [PubMed] [Google Scholar]
- 14.Molberg Ø et al. Tissue transglutaminase selectively modifies gliadin peptides that are recognized by gut-derived T cells in celiac disease. Nat. Med 4, 713–717 (1998). [DOI] [PubMed] [Google Scholar]
- 15.Kim CY, Quarsten H, Bergseng E, Khosla C & Sollid LM Structural basis for HLA-DQ2-mediated presentation of gluten epitopes in celiac disease. Proc. Natl. Acad. Sci. USA 101, 4175–4179 (2004). [DOI] [PMC free article] [PubMed] [Google Scholar]
- 16.Simmonds M & Gough S The HLA region and autoimmune disease: associations and mechanisms of action. Curr. Genomics 8, 453–465 (2009). [DOI] [PMC free article] [PubMed] [Google Scholar]
- 17.Dendrou CA, Petersen J, Rossjohn J & Fugger L HLA variation and disease. Nat. Rev. Immunol 18, 325–339 (2018). [DOI] [PubMed] [Google Scholar]
- 18.Crux NB & Elahi S Human Leukocyte Antigen (HLA) and immune regulation: how do classical and non-classical HLA alleles modulate immune response to human immunodeficiency virus and hepatitis C virus infections? Front. Immunol 8, 832 (2017). [DOI] [PMC free article] [PubMed] [Google Scholar]
- 19.Jung D & Alt FW Unraveling V(D)J recombination: insights into gene regulation. Cell 116, 299–311 (2004). [DOI] [PubMed] [Google Scholar]
- 20.Dupic T, Marcou Q, Walczak AM & Mora T Genesis of the αβ T-cell receptor. PLoS Comput. Biol 15, e1006874 (2019). [DOI] [PMC free article] [PubMed] [Google Scholar]
- 21.Lu J et al. Molecular constraints on CDR3 for thymic selection of MHC-restricted TCRs from a random pre-selection repertoire. Nat. Commun 10, 1019 (2019). [DOI] [PMC free article] [PubMed] [Google Scholar]
- 22.Klein L, Kyewski B, Allen PM & Hogquist KA Positive and negative selection of the T cell repertoire: What thymocytes see (and don’t see). Nat. Rev. Immunol 14, 377–391 (2014). [DOI] [PMC free article] [PubMed] [Google Scholar]
- 23.Sakaguchi N et al. Altered thymic T-cell selection due to a mutation of the ZAP-70 gene causes autoimmune arthritis in mice. Nature 426, 454–460 (2003). [DOI] [PubMed] [Google Scholar]
- 24.Kishimoto H & Sprent J A defect in central tolerance in NOD mice. Nat. Immunol 2, 1025–1031 (2001). [DOI] [PubMed] [Google Scholar]
- 25.Liston A, Lesage S, Wilson J, Peltonen L & Goodnow CC Aire regulates negative selection of organ-specific T cells. Nat. Immunol 4, 350–354 (2003). [DOI] [PubMed] [Google Scholar]
- 26.Emerson RO et al. Immunosequencing identifies signatures of cytomegalovirus exposure history and HLA-mediated effects on the T cell repertoire. Nat. Genet 49, 659–665 (2017). [DOI] [PubMed] [Google Scholar]
- 27.Glanville J et al. Identifying specificity groups in the T cell receptor repertoire. Nature 547, 94–98 (2017). [DOI] [PMC free article] [PubMed] [Google Scholar]
- 28.Sharon E et al. Genetic variation in MHC proteins is associated with T cell receptor expression biases. Nat. Genet 48, 995–1002 (2016). [DOI] [PMC free article] [PubMed] [Google Scholar]
- 29.Okada Y et al. Contribution of a non-classical HLA gene, HLA-DOA, to the risk of rheumatoid arthritis. Am. J. Hum. Genet 99, 366–374 (2016). [DOI] [PMC free article] [PubMed] [Google Scholar]
- 30.Hinks A et al. Fine-mapping the MHC locus in juvenile idiopathic arthritis (JIA) reveals genetic heterogeneity corresponding to distinct adult inflammatory arthritic diseases. Ann. Rheum. Dis 76, 765–772 (2017). [DOI] [PMC free article] [PubMed] [Google Scholar]
- 31.Chen L et al. Genetic drivers of epigenetic and transcriptional variation in human immune cells. Cell 167, 1398–1414.e24 (2016). [DOI] [PMC free article] [PubMed] [Google Scholar]
- 32.Hennecke J & Wiley DC Structure of a complex of the human α/β T cell receptor (TCR) HA1.7, Influenza hemagglutinin peptide, and major histocompatibility complex class II molecule, HLA-DR4 (DRA*0101 and DRBI*0401): insight into TCR cross-restriction and alloreactivity. J. Exp. Med 195, 571–581 (2002). [DOI] [PMC free article] [PubMed] [Google Scholar]
- 33.Hahn M, Nicholson MJ, Pyrdol J & Wucherpfennig KW Unconventional topology of self peptide-major histocompatibility complex binding by a human autoimmune T cell receptor. Nat. Immunol 6, 490–496 (2005). [DOI] [PMC free article] [PubMed] [Google Scholar]
- 34.Deng L et al. Structural basis for the recognition of mutant self by a tumor-specific, MHC class II-restricted T cell receptor. Nat. Immunol 8, 398–408 (2007). [DOI] [PubMed] [Google Scholar]
- 35.Atchley WR, Zhao J, Fernandes AD & Drüke T Solving the protein sequence metric problem. Proc. Natl. Acad. Sci. USA 102, 6395–6400 (2005). [DOI] [PMC free article] [PubMed] [Google Scholar]
- 36.Stadinski BD et al. Hydrophobic CDR3 residues promote the development of self-reactive T cells. Nat. Immunol 17, 946–955 (2016). [DOI] [PMC free article] [PubMed] [Google Scholar]
- 37.Christophersen A et al. Distinct phenotype of CD4+ T cells driving celiac disease identified in multiple autoimmune conditions. Nat. Med 25, 734–737 (2019). [DOI] [PMC free article] [PubMed] [Google Scholar]
- 38.Qiao S-W et al. Posttranslational modification of gluten shapes TCR usage in celiac sisease. J. Immunol 187, 3064–3071 (2011). [DOI] [PubMed] [Google Scholar]
- 39.Dahal-Koirala S et al. TCR sequencing of single cells reactive to DQ2.5-glia-α2 and DQ2.5-glia-ω2 reveals clonal expansion and epitope-specific V-gene usage. Mucosal Immunol 9, 587–596 (2016). [DOI] [PubMed] [Google Scholar]
- 40.Han A et al. Dietary gluten triggers concomitant activation of CD4+ and CD8+ αβ T cells and γλ T cells in celiac disease. Proc. Natl. Acad. Sci. USA 110, 13073–13078 (2013). [DOI] [PMC free article] [PubMed] [Google Scholar]
- 41.Petersen J et al. T-cell receptor recognition of HLA-DQ2-gliadin complexes associated with celiac disease. Nat. Struct. Mol. Biol 21, 480–488 (2014). [DOI] [PubMed] [Google Scholar]
- 42.DeWitt WS et al. Human T cell receptor occurrence patterns encode immune history, genetic background, and receptor specificity. Elife 7, e38358 (2018). [DOI] [PMC free article] [PubMed] [Google Scholar]
- 43.Madi A et al. T cell receptor repertoires of mice and humans are clustered in similarity networks around conserved public CDR3 sequences. Elife 6, e22057 (2017). [DOI] [PMC free article] [PubMed] [Google Scholar]
- 44.Kula T et al. T-Scan: a genome-wide method for the systematic discovery of T cell epitopes. Cell 178, 1016–1028.e13 (2019). [DOI] [PMC free article] [PubMed] [Google Scholar]
- 45.Bentzen AK et al. Large-scale detection of antigen-specific T cells using peptide-MHC-I multimers labeled with DNA barcodes. Nat. Biotechnol 34, 1037–1045 (2016). [DOI] [PubMed] [Google Scholar]
METHODS-ONLY REFERENCES
- 46.James EA et al. Citrulline-specific Th1 cells are increased in rheumatoid arthritis and their frequency is influenced by disease duration and therapy. Arthritis Rheumatol 66, 1712–1722 (2014). [DOI] [PMC free article] [PubMed] [Google Scholar]
- 47.Rims C et al. Citrullinated aggrecan epitopes as targets of autoreactive CD4+ T cells in patients with rheumatoid arthritis. Arthritis Rheumatol 71, 518–528 (2019). [DOI] [PMC free article] [PubMed] [Google Scholar]
- 48.Cerosaletti K et al. Single-cell RNA sequencing reveals expanded clones of islet antigen-reactive CD4+ T cells in peripheral blood of subjects with type 1 diabetes. J. Immunol 199, 323–335 (2017). [DOI] [PMC free article] [PubMed] [Google Scholar]
Associated Data
This section collects any data citations, data availability statements, or supplementary materials included in this article.
Supplementary Materials
Data Availability Statement
All raw TCR sequence data and genotype data of the discovery dataset and the replication dataset are available at Adaptive Biotechnologies immuneACCESS site (https://clients.adaptivebiotech.com/pub/emerson-2017-natgen) and European Genome-phenome Archive under the accession code of EGAD00001002671 and EGAD00001002663 (https://www.ebi.ac.uk/ega/home). All summary statistics of cdr3-QTL analysis are available at our website (https://github.com/immunogenomics/cdr3-QTL).


