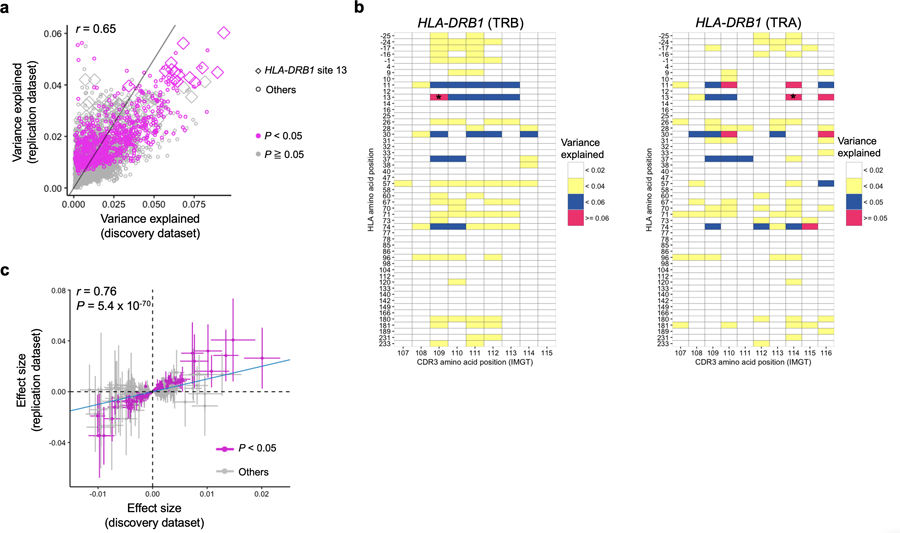
Extended Data Fig. 5. MMLM and LM results in the replication dataset.

a, Explained variance in the MMLM analysis in the discovery dataset (n = 628; peripheral blood) compared with that in the replication dataset (n=169; naïve CD4+ T cells). All pairs of class II HLA sites and CDR3 phenotypes are shown without any filtering (9,735 data points). The results at HLA-DRB1 site 13 and the results with P < 0.05 in the replication dataset are highlighted. b, Explained variance in the MMLM analysis in the replication dataset (n = 169; naïve CD4+ T cells). For each HLA site-CDR3 position pair, the largest variance explained across different CDR3 lengths are shown in a heatmap. The results of HLA-DRB1 are provided. Only associations with P < 0.05 are colored in the heatmap. The results both for alpha and beta chains are provided. The pair with the largest variance is indicated by an asterisk. c, LM analysis using the replication dataset (n = 169; naïve CD4+ T cells). Effect sizes for non-transformed phenotypes from discovery and replication datasets are provided. The error bar indicates ± 2 × s.e. The nominally significant associations in the replication dataset are highlighted in red (P < 0.05). The analysis was restricted to the 388 CDR3 phenotypes (length-position-amino acid combinations) that had at least one significant association in the LM analysis (P < 0.05/1,249,742 total tests) and were testable in the replication dataset. For each CDR3 phenotype, we used the HLA amino acid allele that had the lowest P value for that phenotype in the LM analysis of the discovery dataset. We used P values from two-sided linear regression test.
