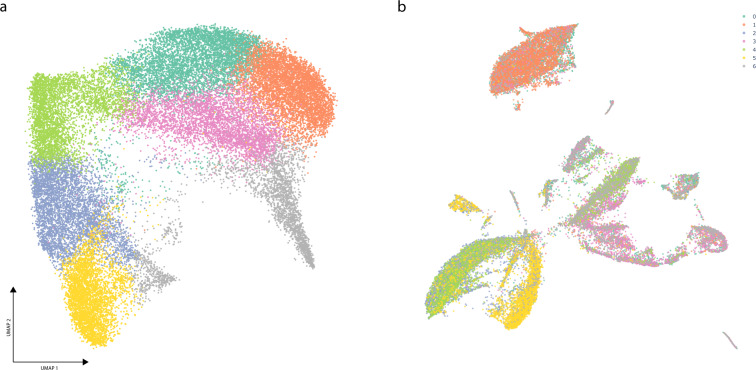
Fig. 3. SNARE-seq data analysis in Cellar.
(IDs: kidney SNARE ATAC/RNA 20201005) (a) UMAP plot of the chromatin modality for the kidney SNARE-seq dataset with 31,758 cells. First, we obtain a cell-by-cistopic matrix by running cisTopic which is then used to define clusters via Leiden clustering. b Corresponding UMAP plot of the expression matrix with cluster assignments copied from a. Cellar’s dual mode allows a cell ID based label transfer from one modality to the other.

