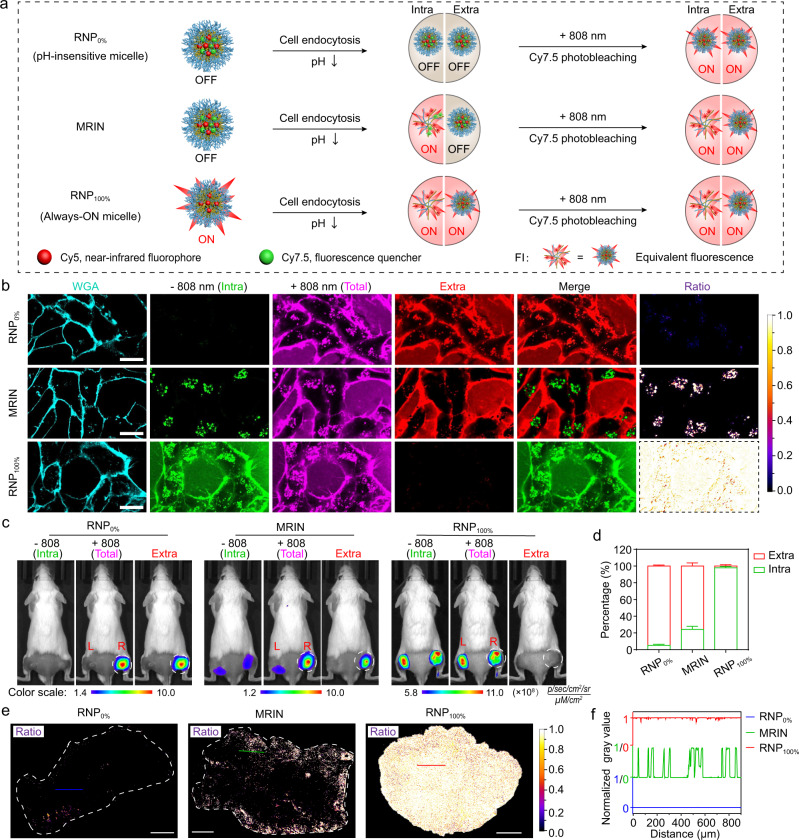
Fig. 3. Methodology of MRIN for quantifying intracellular and extracellular distribution of nanoparticles.
a Schematic illustration of Cy5 fluorescence amplification for RNP0%, MRIN, and RNP100% in response to sequential cellular endocytosis and 808 nm irradiation. b 4T1 cells were incubated with RNP0%, MRIN, and RNP100% at 37 °C for 0.5 h, respectively, then the cells were irradiated in situ with an 808 nm laser. The image of extracellular nanoparticles was calculated by subtracting the pre-irradiated Cy5 fluorescence image from the post-irradiated Cy5 fluorescence image, and the merged images were presented in pseudo-color green and red for intracellular and extracellular NPs, respectively. The ratio channel displayed the intracellular distribution of nanoparticles. The images of RNP0% and RNP100% before 808 nm irradiation were served as the extrapolated states of 0% and 100% internalization of nanoparticles. Scale bar = 20 μm. c In vivo fluorescence images of the bilateral 4T1 tumor-bearing mice with irradiation on right tumors at 24 h post-injection of RNP0%, MRIN, and RNP100%. The images of extracellular nanoparticles were obtained by subtracting pre-irradiated Cy5 fluorescence images from post-irradiated Cy5 fluorescence images. The circles indicate the irradiated right tumors. d The percentage of intracellular and extracellular nanoparticle exposure from Fig. 3c (n = 4 biologically independent mice). e The ratiometric fluorescence images of intracellular nanoparticles versus total distributed nanoparticles in tumor sections at 24 h post-injection. f The values of ratiometric signal indicate endocytic events cross the corresponding line in Fig. 3e, value “1” and “0” represent endocytic NPs and non-endocytic NPs, respectively. All data were presented as mean ± s.d.

