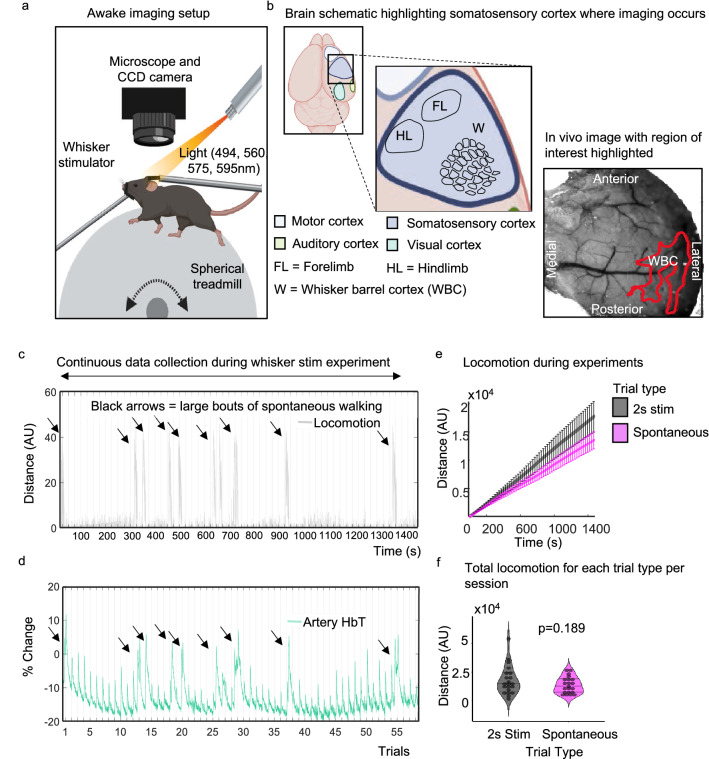
Figure 1.
Awake imaging experimental set up. (a) Animals were head fixed and could run on a spherical treadmill. Locomotion data was collected using an optical motion sensor (attached to the ball—not shown). Light (495, 559, 575, 587 nm) was shone onto the thinned cranial window, and haemodynamic responses were collected during 2 s whisker stimulation trials and during spontaneous (no whisker stimulation) trials. (b) Shows a schematic of the mouse brain, zooming in on the somatosensory cortex where imaging occurs, a representative in vivo image with the whisker ROI is also shown. (c) and (d) show representative plots of the distance travelled (grey) and percentage change in HbT (green, taken from an artery within the whisker ROI (see in vivo image (b)) across the 2 s whisker experiment (continuous data recording of the 59 whisker-stimulation trials taken from one representative animal/session, black lines on x axis mark individual 25 s stimulation trials) respectively. Black arrows show large bouts of spontaneous walking. (e) shows total distance travelled during whisker stimulation trials (black/grey) compared to spontaneous trials (pink) averaged for all 21 sessions. Error bars represent ± SEM. (f) shows a violin plot with individual points to show the distance travelled during each session for the different trial types (2 s whisker stimulation and spontaneous trials with no whisker stimulation) (Sign test p = 0.189). Black lines on violin plot represent interquartile range and median. Awake imaging experimental figure (a) and (b) created with BioRender.com. (b) ((in vivo image) also used in Sharp et al.,20, see Fig. 4B).

