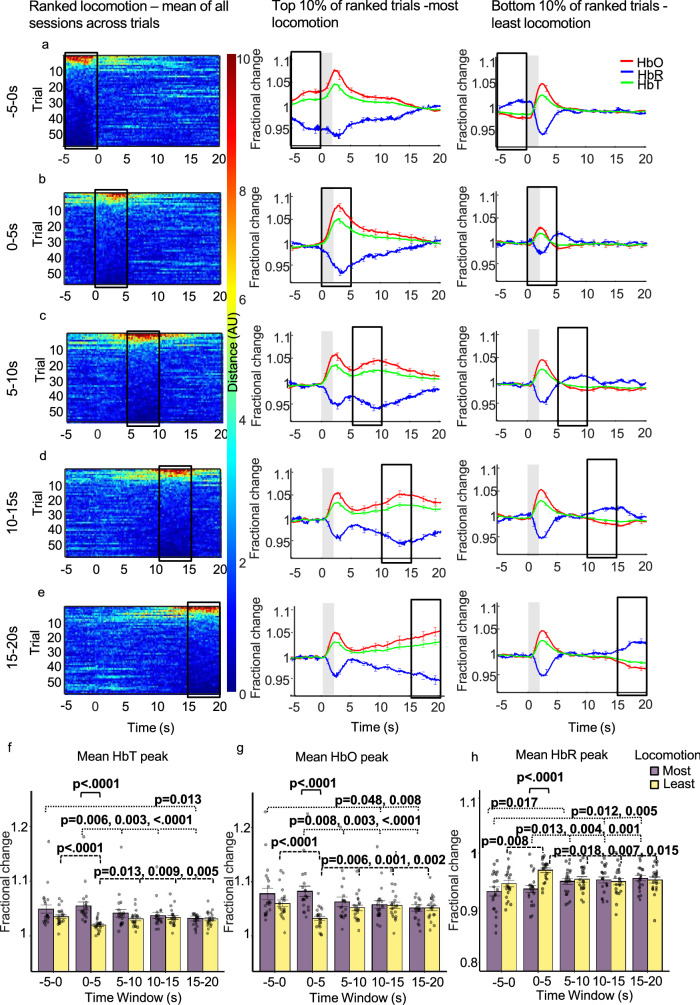
Figure 3.
Mean sensory-evoked haemodynamic responses for the whisker ROI (Fig. 5 column 1) during trials where the most and least locomotion occurred with locomotion ranked at different time windows throughout the 25 s trial. Whisker stimulation between 0 and 2 s (grey bar in centre and right columns). Column one: heat maps showing locomotion traces for the 59 whisker-stimulation trials, with locomotion ranked at different 5 s time windows during the 25 s trial (each ranked trial was averaged across 21 sessions/4 animals). The different 5 s windows during the 25 s trial where locomotion was ranked are: before (a: − 5 to 0 s), during (b: 0–5 s) and after whisker stimulation (c: 5–10 s, d: 10–15 s, e: 15–20 s). Trials were ranked according to locomotion in these 5 s periods and presented in descending order. Colour bar indicates amount of locomotion, red pixels indicate more and dark blue indicate less locomotion. Column two: mean fractional changes from baseline in stimulation-dependent HbT, HbO and HbR taken from the top 10% of ranked locomotion trials across the different 5 s time windows (21 sessions/4 animals; n = 6 top per session (mean of top trials taken for each session, mean of all sessions used in the visualisation/analysis). Column three: mean fractional changes in stimulation-dependent HbT, HbO and HbR for the bottom 10% of locomotion trials ranked across the 5 s time windows throughout the trial (21 sessions/4 animals; n = 6 bottom per session (mean of bottom trials taken for each session, mean of all sessions used in the visualisation/analysis). Black boxes indicate the 5 s time window locomotion was ranked. Data show mean across the total 126 trials ± SEM. (f–h) show mean ± SEM between groups and individual mean peak values per session for HbT, HbO and HbR. Two-way repeated measures ANOVA’s were completed for HbT, HbO and HbR. Significant interactions were found and simple effects run (time and locomotion) for each haemodynamic measure. p values from pairwise comparisons (Bonferroni correction) are reported. Black solid brackets indicate comparison between most and least locomotion, dotted brackets reveal comparisons for most locomotion across different time windows and dashed brackets show comparisons for least locomotion across different time windows.

