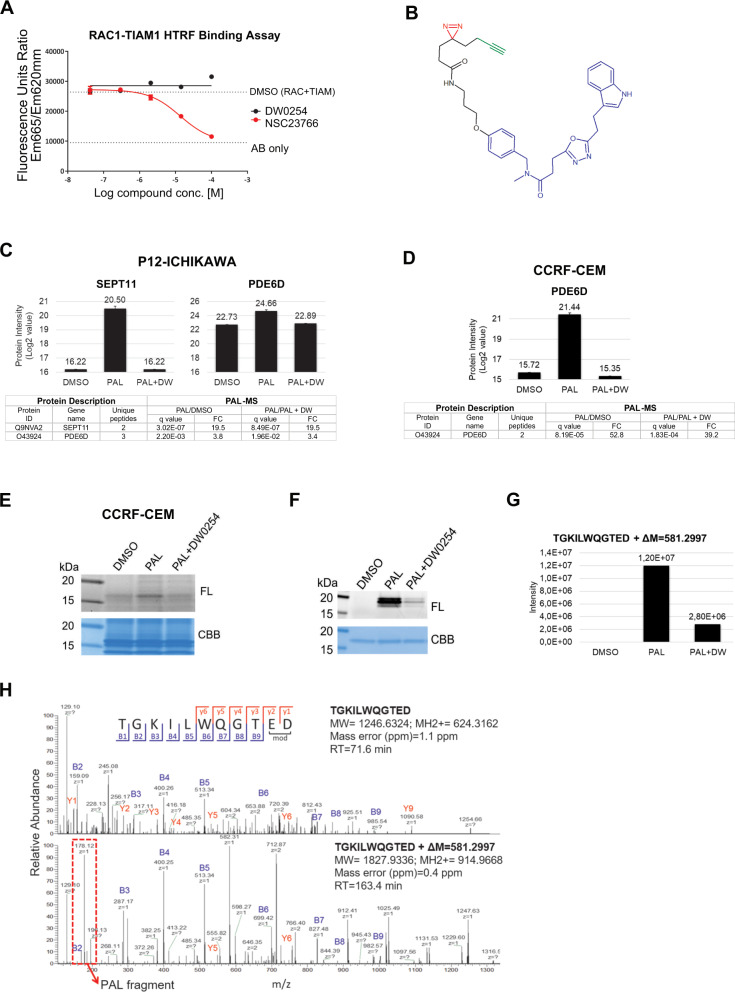
Fig. 3. Identification of the DW0254 molecular target PDE6D by photoaffinity labeling mass spectrometry (PALMS).
A Compound titration in the RAC1-TIAM1 homogeneous time-resolved fluorescence assay (HTRF) assay showing competition with increasing concentrations of test compounds (either NSC23766 or DW0254) on X-axis and fluorescence emission (Y-axis). B Chemical structure of DW0254-photoprobe PAL. The DW0254 warhead is colored in blue, the photoreactive diazirine group in red, and the alkyne clickable group in green. C top: MS signal intensity of protein target hits of DW0254 in the pulldown samples of P12-ICHIKAWA cells. Histogram plots represent quantitative determination of PDE6D and SEPT11 MS signal intensity in the different pulldown samples (DMSO, PAL alone, and PAL in combination with a 20-fold molar excess of DW0254). Conditions analyzed included P12-ICHIKAWA cells that were treated with PAL (1 µM) ± DW0254 (20 µM) prior UV irradiation, streptavidin pulldown and label-free differential quantitative mass spectrometry analysis. Three biological replicates for each sample were performed. bottom: Summary of the significant protein target hits of PAL identified in P12-ICHIKAWA; Proteins with an adjusted p-value (or q value) <5% and a FC of >2 were selected to be differentially modulated. A protein was considered as a hit of DW0254 when identified with at least two peptides in minimum two out of three replicates, FC > 2 and adjusted p-values < 0.05 in the two comparisons, PAL/DMSO and PAL/PAL + DW0254. D top: MS signal intensity of PDE6D in CCRF-CEM pulldown samples. Histogram plots represent quantitative determination of PDE6D MS signal intensity in the different pulldown samples (DMSO, PAL alone, and PAL in combination with a 20-fold molar excess of DW0254). Y-axis shows log2 value of protein identified. Proteins eluted from the beads were separated by SDS-PAGE and protein bands within the molecular weight range 15–18 kDa were excised. Proteins were prepared for downstream label-free differential quantitative mass spectrometry analysis. Three biological replicates for each sample were performed. bottom: Summary of the significant protein target hits of PAL identified in CCRF-CEM cells; Proteins with an adjusted p-value (or q value) <5% and a FC of >2 were selected to be differentially modulated. A protein was considered as a hit of DW0254 when identified with at least two peptides in minimum two out of three replicates, FC > 2 and adjusted p-values < 0.05 in the two comparisons, PAL/DMSO and PAL/PAL + DW0254. E In-gel fluorescence scanning showing the proteome reactivity profiles of live CCRF-CEM cells photolabeled by PAL (1 µM) with or without DW0254 (20 µM). FL: in-gel fluorescence scanning. CBB: Coomassie gel. F In-gel fluorescence scanning showing the recombinant human His-TEV-PDE6D-Avitag protein photolabeled by PAL (1 µM) with or without DW0254 (20 µM). FL: in-gel fluorescence scanning. CBB: Coomassie gel. G Single-stage LC-MS (MS1) intensity values of PAL-modified peptide TGKILWQGTED following His-TEV-PDE6D-Avitag protein labeling with PAL in competition with DW0254. The peptide adduct was identified in the sample irradiated with PAL in the presence of DW0254 but with a peak intensity >4-fold lower compared to the sample irradiated with PAL alone. H The second stage of mass spectrometry (MS2) for the PAL-modified peptide TGKILWQGTED of His-TEV-PDE6D-Avitag protein. MS2 spectra of the probe-modified peptide 1827.9216 m/z and its intact counterpart 1246.6193 m/z. Unlabeled fragment ions y1–y6 and b1–b9 were detected in both the PAL-modified peptide TGKILWQGTED and its intact counterpart. The fragment ion +178.12 m/z cleaved from PAL1 upon CID fragmentation was detected only in the MS2 spectrum of the PAL1-modified peptide.

