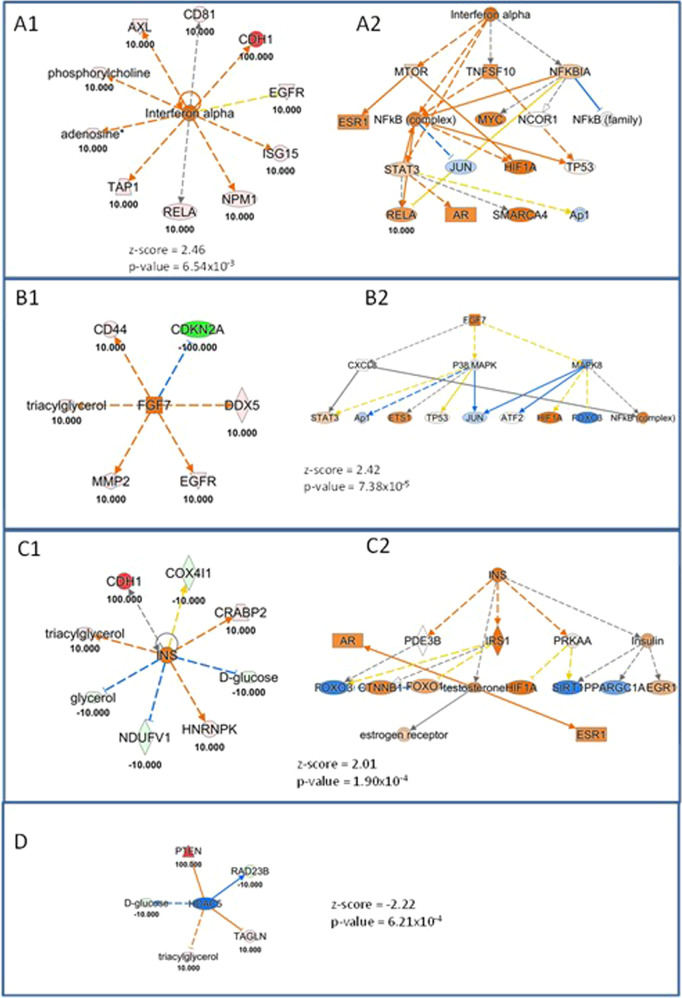
Fig. 2. Upstream Regulator Analysis, based on “omics” integration using the Ingenuity Pathway Analysis software.
Orange and blue shapes represent predicted activation or inhibition, respectively. The predicted relationship between genes may lead to direct activation (orange solid lines) or direct inhibition (blue solid lines). Red and green color indicate genes, proteins, and metabolites increased and decreased in expression, respectively, while the numbers represent the measurements of their expression. A1 shows the proteins and metabolites of the loaded dataset involved in the activation of the upstream regulator Interferon alpha. A2 shows the mechanistic network, theoretically reconstructed that underlies the activation of the upstream Interferon alpha. B1 shows the proteins and metabolites of the loaded dataset involved in the activation of the upstream regulator Fibroblast growth factor 7 (FGF7). B2 shows the mechanistic network, theoretically reconstructed that underlies the activation of the upstream FGF7. C1 shows the proteins and metabolites of the loaded dataset involved in the activation of the upstream regulator Insulin (INS). C2 shows the mechanistic network, theoretically reconstructed that underlies the activation of the upstream INS. D shows the proteins and metabolites of the loaded dataset involved in the down-regulation of the upstream regulator Histone deacetylase 5 (HDAC5).

