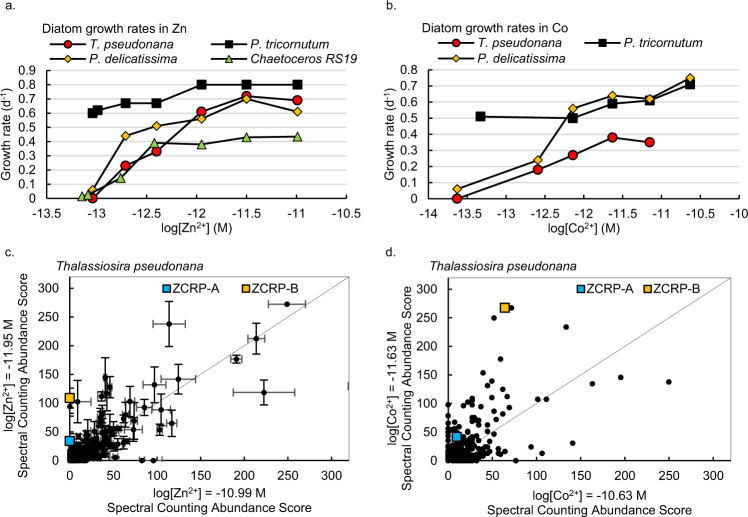
Fig. 1. Growth responses of diatoms to varying [Zn2+] and [Co2+] and initial detection of ZCRPs in T. pseudonana.
Growth rates of four diatoms over a range of a [Zn2+] and b [Co2+]. Data are presented as mean values of biological duplicate cultures. Data is available in Supplementary Table 1. Global proteomic analyses comparing the proteomes of pooled biological duplicate cultures (n = 2) of T. pseudonana in c high vs. low added Zn and d high vs. low added Co. Each point is an identified protein with the mean of technical triplicate abundance scores in one treatment plotted against the mean of abundance scores in another treatment. The solid line denotes 1:1 abundance. Error bars in c are the standard deviation of technical triplicate measurements.

