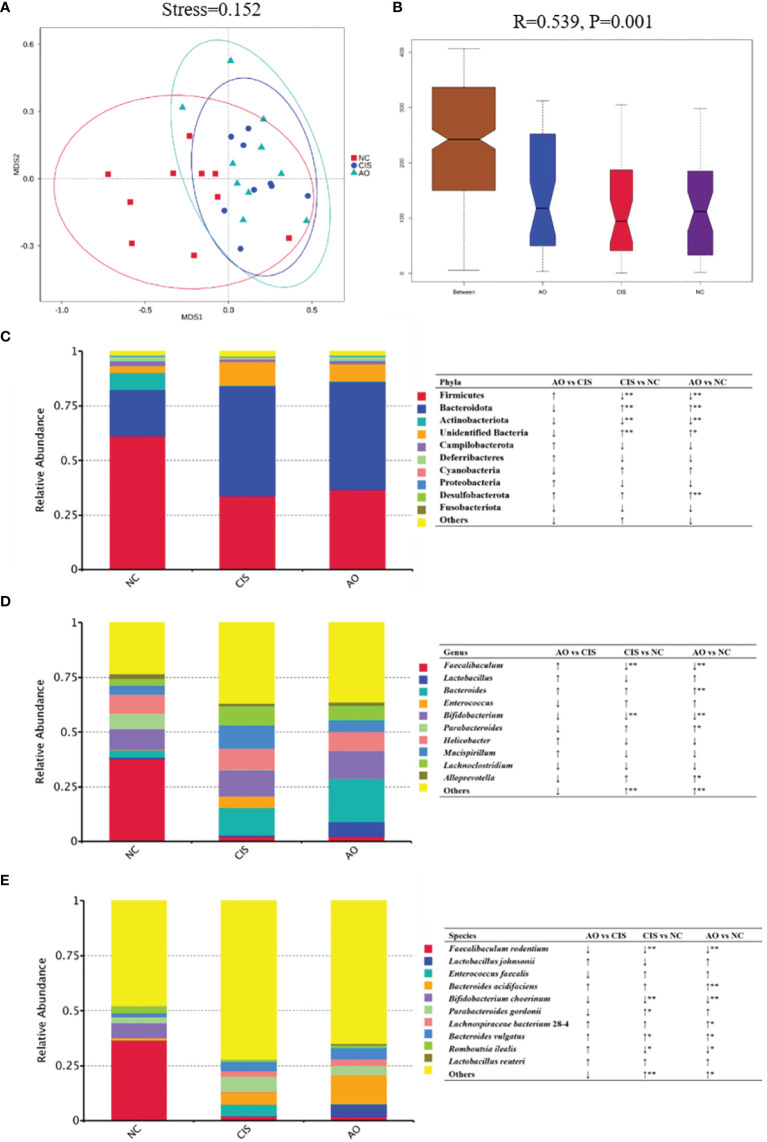
Figure 2.
Gut microbiota analysis. (A) Non-metric dimensional scaling (NMDS) plots; (B) ANOSIM analysis of the significance of separation between the NC, CIS, and AO groups; (C) relative abundance of the top 10 phyla; (D) relative abundance of top ten genus; (E) relative abundance of top ten species; n=10 for the AO and NC groups, n=9 for the CIS group (one mouse in the CIS group died while collecting feces). NC, normal control; CIS, cisplatin; AO, cisplatin with alginate oligosaccharides (*p < 0.05, **p < 0.01; ↑, upregulation; ↓, downregulation).

