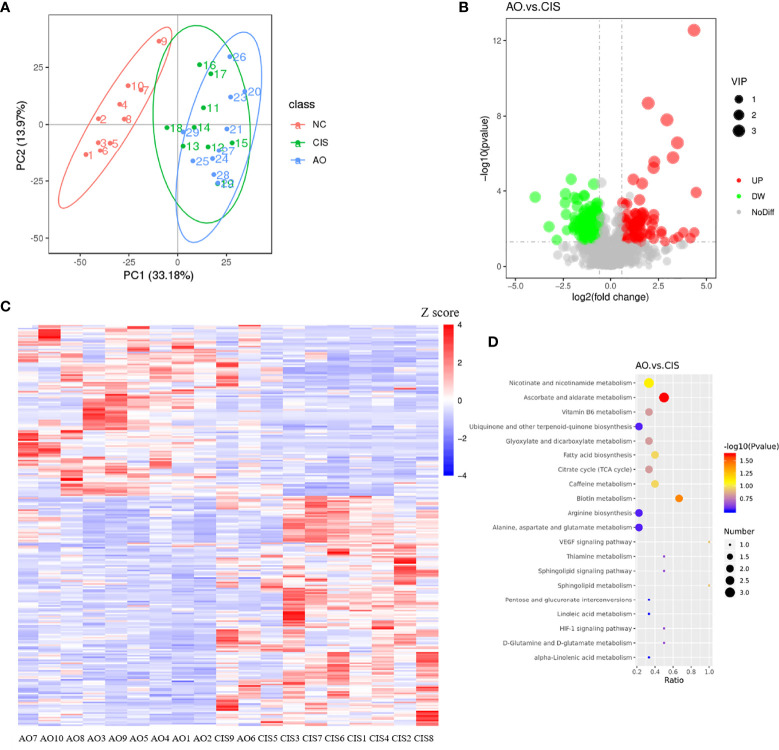
Figure 3.
Metabolomics analysis in feces. (A) principal components analysis (PCA) of all metabolic pathways in three groups; (B) volcano map of differential metabolites between AO group and CIS group; (C) heat map of differential metabolites between AO group and CIS group; (D) KEGG analysis of differential metabolites between AO and CIS groups. n=10 for the AO and CIS groups, n=9 for the CIS group (one mouse in the CIS group died while collecting feces). Z score value represents the normalized abundance. VIP value represents correlation coefficient.

