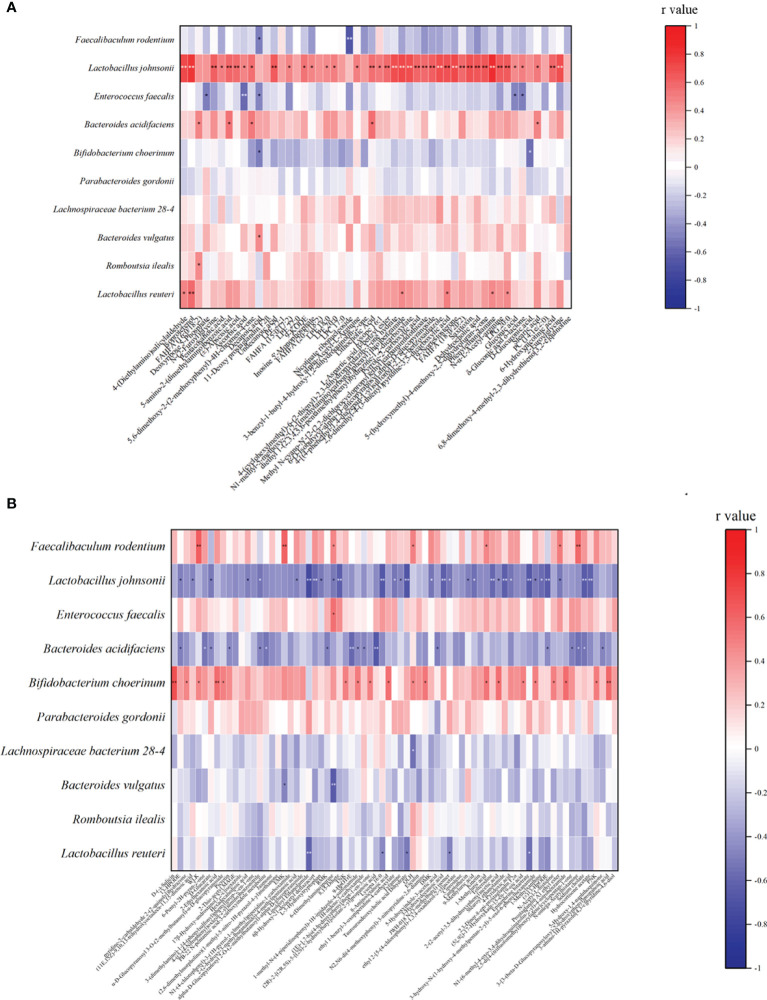
Figure 4.
Spearman correlation analysis between the most significant difference (p<0.01) metabolites and the top 10 microbial species with the highest abundance. (A) The most significant increased metabolites (p<0.01) and the top 10 microbial species with the highest abundance between AO and CIS groups; (B) the most significant decreased metabolites (p<0.01) with the top 10 microbial species with the highest abundance between AO and CIS groups. *p < 0.05, **p < 0.01.

