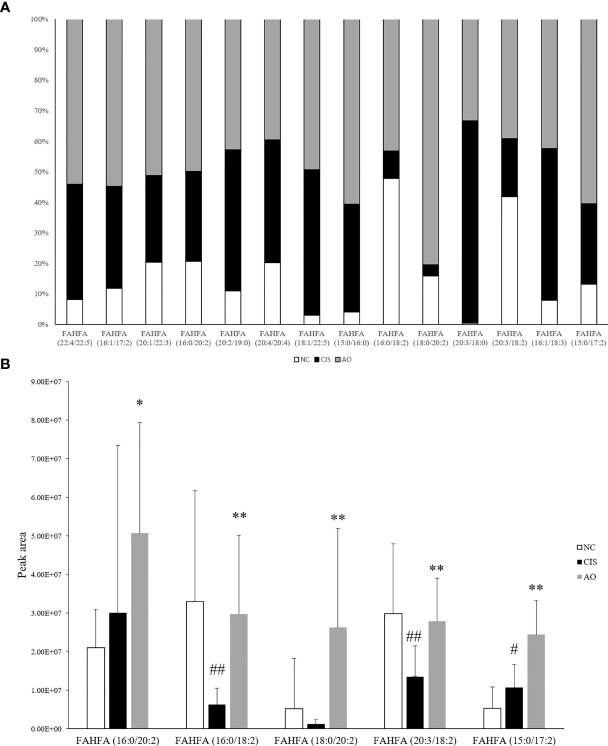
Figure 5.
FAHFAs levels in feces. (A) Comparison diagram of relative content of all we matched FAHFAs; only FAHFA (20:2/19:0), FAHFA (20:4/20:4), FAHFA (20:3/18:0) and FAHFA (16:1/18:3) were decreased in AO vs. CIS. but those FAHFAs were no significant difference between AO and CIS groups (p>0.05). (B) Relative content bar graph showing significant differences in AO vs. CIS FAHFAs; the significance marker on AO indicates AO vs. CIS (*p<0.05, **p<0.01), the significance marker on CIS indicates CIS vs. NC (# p<0.05, ## p<0.01).

