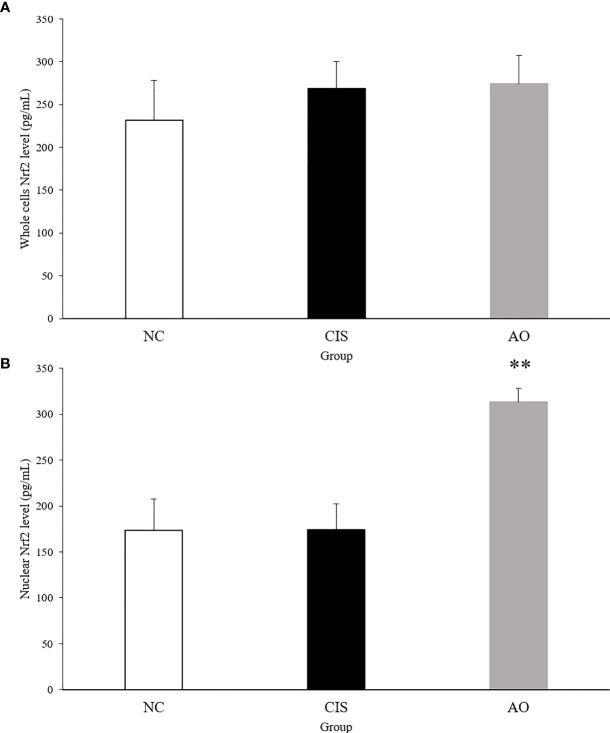
Figure 7.
Nrf2 protein level in kidney tissue. (A) Whole cell Nrf2 protein level in kidney tissue; (B) nuclear Nrf2 protein level in kidney tissue. The significance marker on AO indicates AO vs. CIS (**p<0.01). n=10 for the AO and NC groups, n=7 for the CIS group (three mice in the CIS group died before euthanasia).

