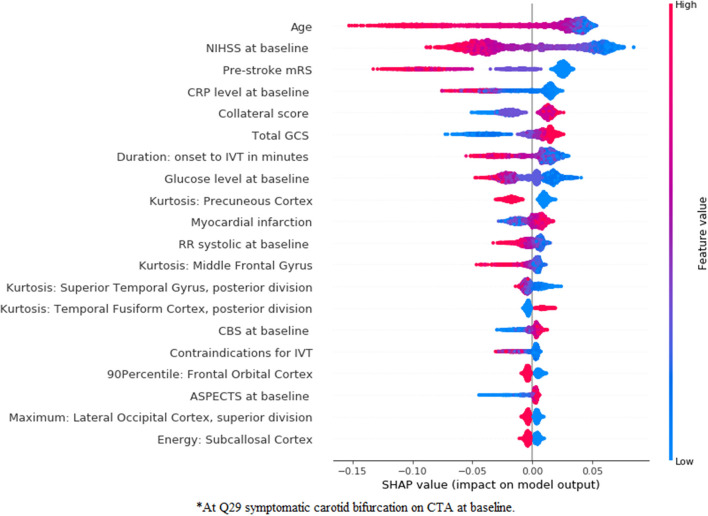
Figure 6.
SHapley Additive exPlanations feature importance for the combination experiment for mRS prediction using an RFC model. For visualization purposes, we included only the top 20 features. Features are shown in order of importance, from most important (top) to less important (bottom). The color legend on the right shows how the feature values influence outcome: high values are depicted in red, while low values are presented in blue. Positive SHAP values (above zero in the x-axis) mean that the feature values are associated with the positive outcome (in this case good functional outcome), while SHAP values below zero indicate the opposite. *At symptomatic carotid bifurcation on CTA at baseline.

