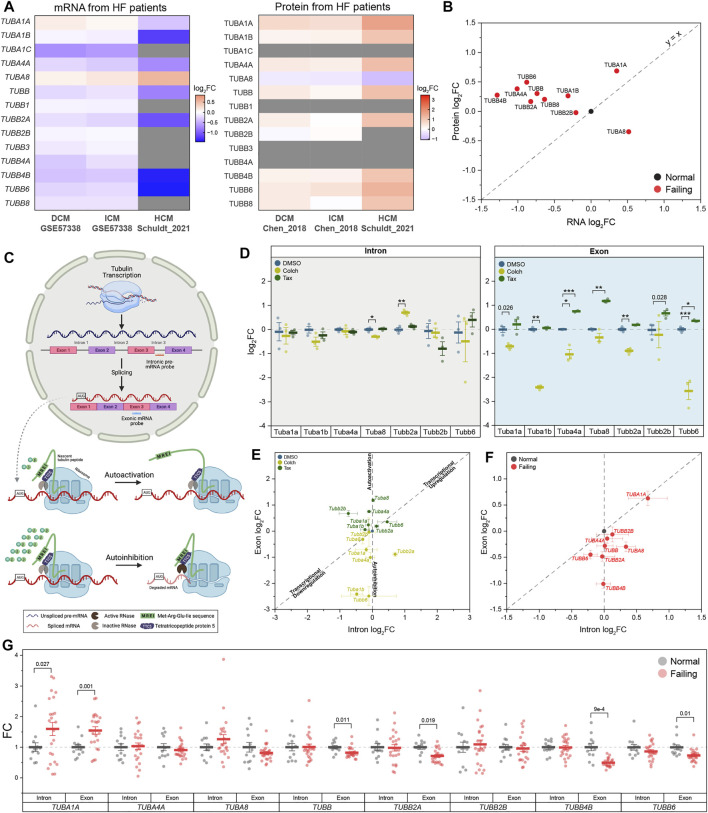
FIGURE 1.
Tubulin autoregulation is operant in the heart and activated in heart failure. (A) Heatmaps of previously published mRNA (left) & protein (right) data of human αβ-tubulin isoforms during dilated (DCM) (Liu et al., 2015, Chen et al., 2018), ischemic (ICM) (Liu et al., 2015, Chen et al., 2018), & hypertrophic (HCM) (Schuldtet al., 2021) cardiomyopathies. (B) Scatter-plot of log2fold-change of mRNA on x-axis and log2fold-change of protein on y-axis in heart failure; each data point represents an average log2fold-change value from DCM and ICM groups from (A), and y = x represents a proportionate change between mRNA and peptide. (C) Schematic of tubulin autoregulation: The introns of tubulin pre-mRNA are spliced out and the mRNA is fully translated in the absence of excess free tubulin; in the presence of excess free tubulin, the mRNA, but not the pre-mRNA, is degraded. (D) Relative log2fold-change of mRNA counts of intronic (left) and exonic (right) αβ-tubulin isoforms in isolated adult mouse cardiomyocytes after treatment with either depolymerizing (Colch) or polymerizing (Tax) agents (n = 3); whiskers represent ± 1SEM, bolded line represents mean, * represents p-value from Welch-corrected two-tailed two-sample t-test on non-log data <0.025 (Bonferroni-corrected for two comparisons), ** representsp < 0.01, and *** represents p < 0.001. (E) Scatter-plot of relative log2fold-change of intron on x-axis and exon on y-axis after Colch or Tax treatment in adult mouse cardiomyocytes; whiskers represent ± 1SEM. (F) Scatter-plot of relative log2fold-change of intron on x-axis and exon on y-axis in near-normal and failing patient heart samples; whiskers represent ± 1SEM. (G) Relative fold-change of mRNA counts of intronic and exonic αβ-tubulin isoforms in near-normal and failing patient heart samples; whiskers represent ± 1SEM, bolded line represents mean, and p-values are from Welch-corrected two-tailed two-sample t-test.

