FIGURE 2.
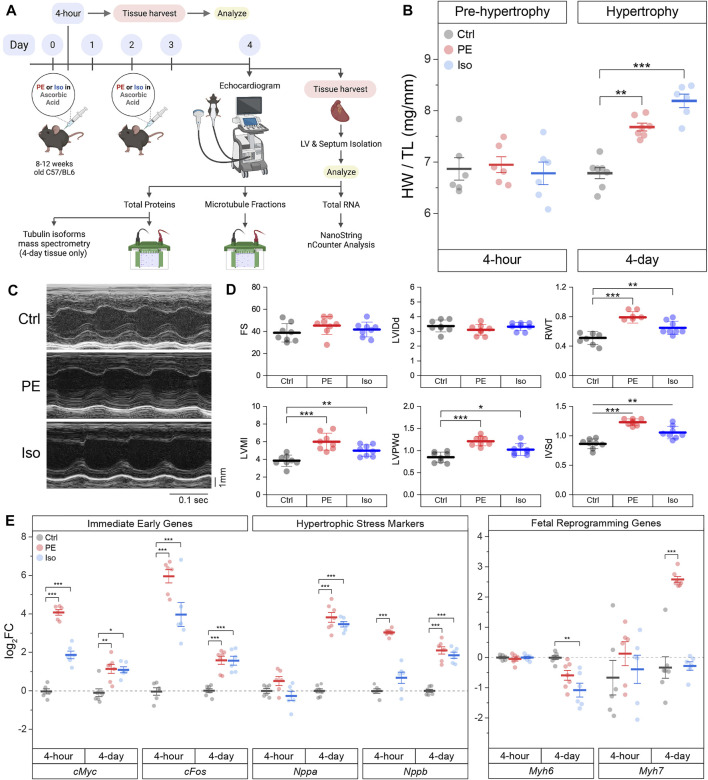
Acute α- or β- adrenergic stimulation induces cardiac hypertrophy. (A) Graphical scheme of the experimental plan. (B) Heart-weight/Tibia length (HW/TL) data of mice 4-h (n = 6) or 4-days (n = Ctrl:7, PE:7, Iso:6) following 10 mg/kg/injection of phenylephrine (PE) or 5 mg/kg/injection of isoproterenol (Iso). (C) Representative echocardiographic M-mode images of 4-days mice hearts. (D) Quantification of relevant echocardiographic parameters: FS = Fractional Shortening, LVIDd = Left-Ventricular Internal Diameter at end diastole, RWT = Relative Wall Thickness, LVMI = Left-Ventricular Mass Index, LVPWd = Left-Ventricular Posterior Wall thickness at end diastole, IVSd = InterVentricular Septal thickness at end diastole (n = 8). (E) Relative log2fold-change of nCounter mRNA counts of Immediate Early Genes (IEGs), hypertrophic stress markers, and genes of fetal reprogramming (n = 4 h: 6, 4 days: Ctrl:7, PE:7, Iso:6). For all box plots, whiskers represent ± 1SEM and bolded-lines represent mean. For (B, D), * represents p-value from Welch-corrected two-tailed two-sample student’s t-test < 0.025, ** represents p < 0.01, and *** represents p < 0.001. For (E), * represents Bonferroni adjusted (for 45 genes) p-value < 0.025 (Bonferroni-corrected for two comparisons), ** represents adj_p < 0.01, and *** represents adj_p < 0.001 (see Methods for more statistical details).

