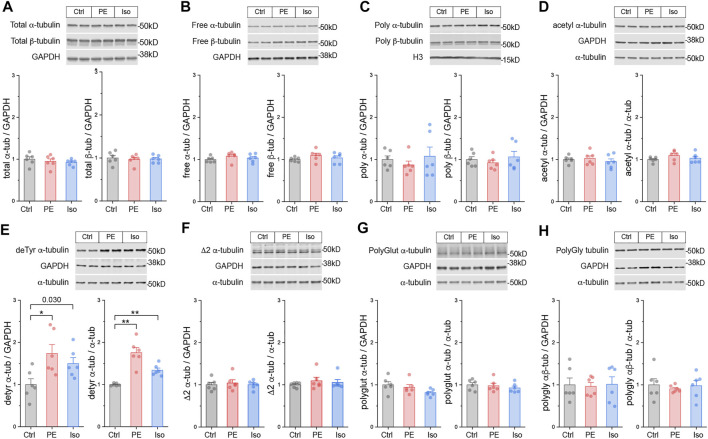
FIGURE 3.
The microtubule network is rapidly detyrosinated upon hypertrophic stimulation. Representative immunblots and relative fold-change of α-tubulin (left) and β-tubulin (right) in (A) total proteins, (B) free or (C) polymerized -tubulin fractions (n = 6). Representative immunoblots with technical duplicate lanes and relative fold-change using GAPDH (left) or α-tubulin (right) as loading controls for (D) acetylated α-tubulin, (E) detyrosinated α-tubulin, (F) Δ2 α-tubulin, (G) polyglutamylated α-tubulin, & (H) polyglycylated pan-tubulin (n = 6). For all bar plots, whiskers represent + 1SEM and bar represents mean. For all graphs, * represents p-value from Welch-corrected two-tailed two-sample t-test < 0.025 (Bonferroni-corrected for two comparisons), ** represents p < 0.01, and *** represents p < 0.001.

