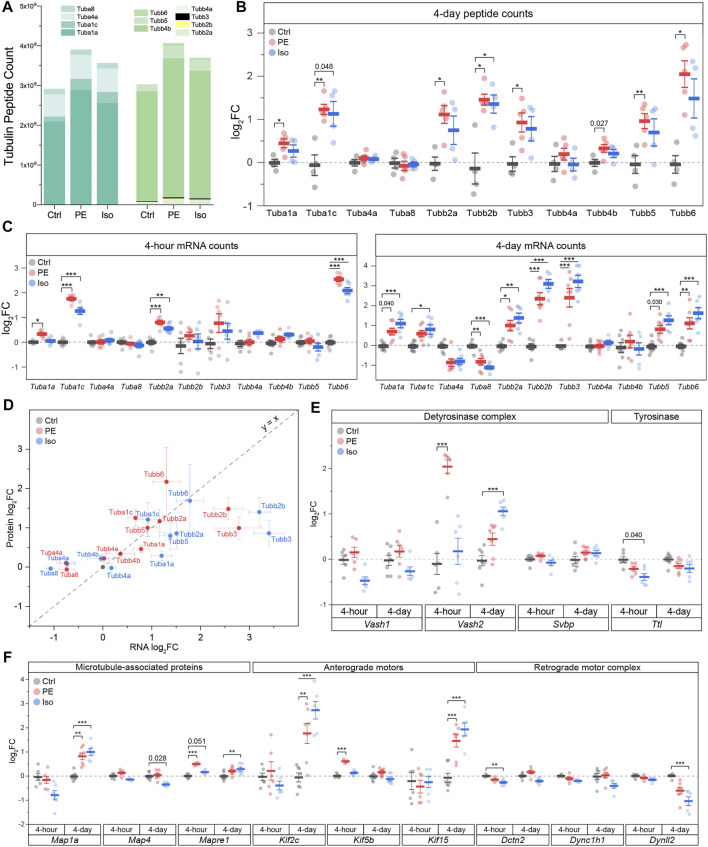
FIGURE 5.
Differential expression of tubulin isoforms, modifying enzymes and MAPs during the onset and establishment of hypertrophy. (A) MS counts of unique peptides of detectable αβ-tubulin isoforms at 4-days timepoint. For all following box plots, whiskers represent ± 1SEM and bolded line represents mean. (B) Relative log2fold-change of αβ-tubulin isoforms peptide counts at 4-days (n = Ctrl: 4, PE: 5, Iso: 4); * represents p-value from Welch-corrected two-tailed two-sample t-test on non-log data <0.025 (Bonferroni-corrected for two comparisons), ** represents p < 0.01, and *** represents p < 0.001. (C) relative log2fold-change of nCounter mRNA counts of detectable tubulin isoforms at 4-h (left) (n = 6) and 4-days timepoints (right) (n = Ctrl:7, PE:7, Iso:6); * represents Bonferroni adjusted (for 50 genes) p-value < 0.025, ** represents adj_p < 0.01, and *** represents adj_p < 0.001 (see Methods and Materials for more statistical details). (D) Scatter-plot of log2fold-change of mRNA on x-axis and log2fold-change of protein on y-axis at 4-days timepoint; whiskers represent ± 1SEM and y = x represents a proportionate change between mRNA and peptide. Relative log2fold-change of nCounter mRNA counts of (E) detyrosinase complex and tyrosinase, & (F) MAPs, anterograde, & retrograde motors at 4-h (n = 6) and 4-days timepoints (n = Ctrl:7, PE:7, Iso:6); * represents Bonferroni adjusted (for 50 genes) p-value < 0.025, ** represents adj_p < 0.01, and *** represents adj_p < 0.001 (see Methods for more statistical details).

