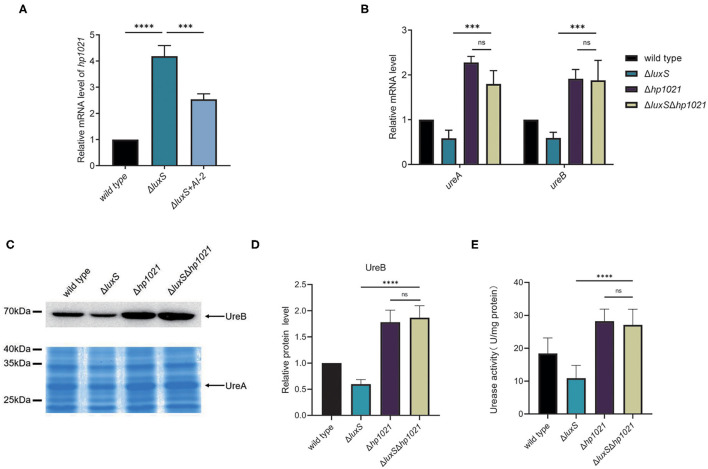
Figure 4.
LuxS induced the expression of urease through HP1021. (A) mRNA expression levels of HP1021 regulated by LuxS and supplemented with AI-2, measured by qPCR. Relative mRNA levels represent mRNA levels of HP1021 in the mutant strain and mutant strain supplemented with AI-2 normalized to those in the wild type strain. (B) mRNA expression of UreA and UreB regulated by LuxS and HP1021. Relative mRNA levels represent mRNA levels of UreA and UreB in the mutant strains normalized to those in the wild type strain. (C) Expression of UreA and UreB proteins regulated by LuxS and HP1021. UreB expression was detected by western blotting, and protein bands are indicated with the arrow. UreA expression was measured by SDS-PAGE gel followed by staining with Coomassie brilliant blue. The arrow indicates UreA protein bands. (D) Densitometric analysis of UreB protein bands. Total protein bands stained with Coomassie brilliant blue were used as loading control. (E) Determination of urease activity in cell lysates. Values are the averages from three biological independent experiments and bars represent standard deviations. ****P < 0.0001, ***P < 0.001, ns, non-significant.

