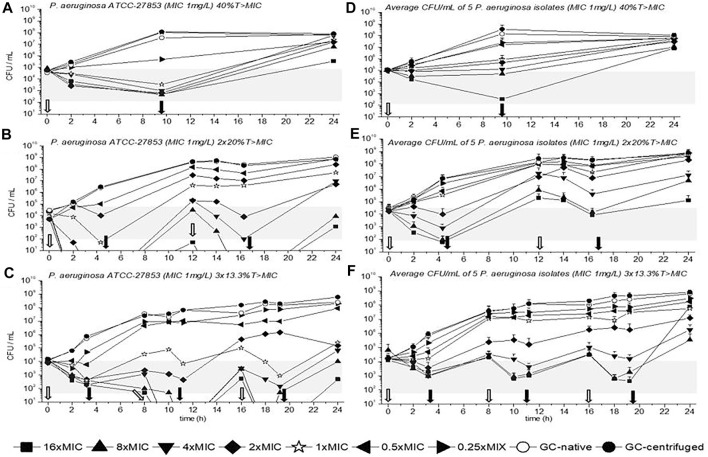
FIGURE 2.
Time kill curves (TKC) with meropenem of P. aeruginosa ATCC-27853 (A), (B), (C) and of the average CFU/mL of five P. aeruginosa isolates (D), (E), (F) are shown over 24 h with standard deviation. In (A), (B), and (C) the standard deviations are very small and overlaid by symbols. The circular symbols represent the growth controls; filled show the centrifuged and empty depict the native growth control (GC). The concentration of the minimal inhibitory concentration (MIC) of the tested strains is given as a star symbol. Empty arrows indicate antibiotic addition and filled arrows indicate antibiotic removal.

