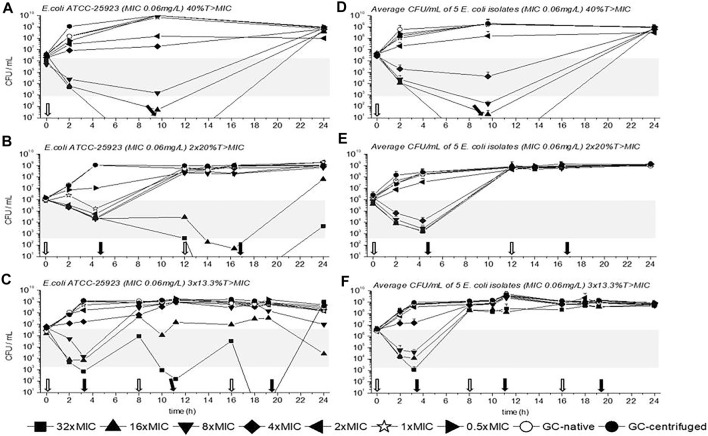
FIGURE 3.
Time kill curves (TKC) with meropenem of E. coli ATCC-25923 (A), (B), (C) and of the average CFU/mL of five E. coli isolates (D), (E), (F) are shown over 24 h with standard deviation. In (A), (B), and (C) the standard deviations are very small and overlaid by symbols. The circular symbols represent the growth controls, filled show the centrifuged, and empty depict the native GC. The concentration of the MIC of the tested strains is given as a star symbol. Empty arrows indicate antibiotic addition and filled arrows indicate antibiotic removal.

