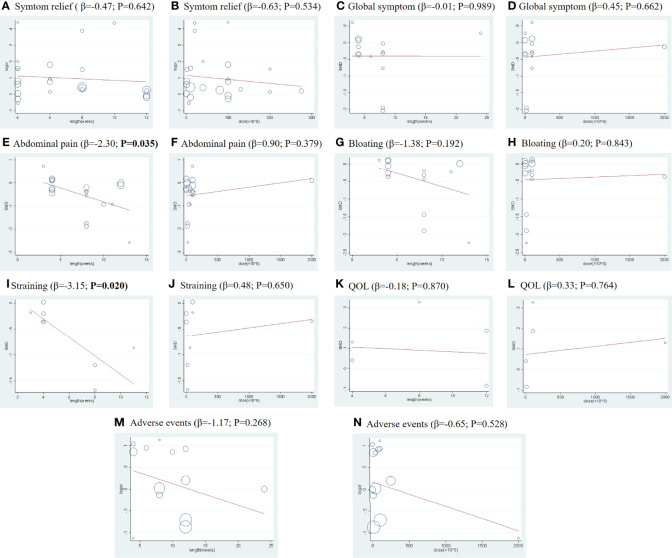
Figure 3.
Meta-regression by treatment lengths and doses for all primary and secondary outcomes: (A, C, E, G, I, K, M) indicate the meta-regression analysis by treatment lengths for the outcomes of symptom relief rate, global symptom score, abdominal pain score, bloating score, straining scores, QOL, and adverse events, respectively; (B, D, F, H, J, L, N) indicate the meta-regression analysis by doses for the outcomes of symptom relief rate, global symptom score, abdominal pain score, bloating score, straining scores, QOL, and adverse events, respectively. The abscissa (X) represents the duration (weeks) or dose (×108), and the ordinate (Y) represents the SMD.

