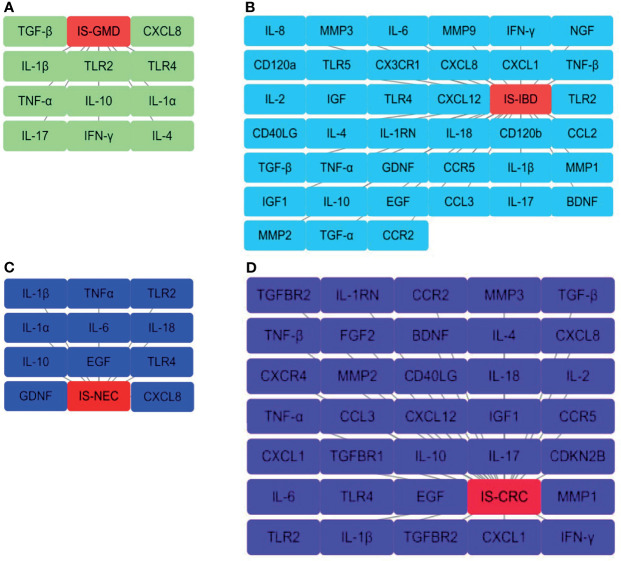
Figure 3.
Interaction networks for the selected cellular immune signals from overlapping targets. These are those that have been identified from the overlapping results of the Venn diagram statistics in (A) IS-GMD, (B) IS-IBD, (C) IS-NEC, (D) IS-CRC group to correlate with T-lymphocytes differentiation or macrophage and microglial cells polarization. The node from each pane represents a selected target and the gray line reflects the interaction with each group. All the data has been reproduced through Cytoscape Version 3.6.0. software.

