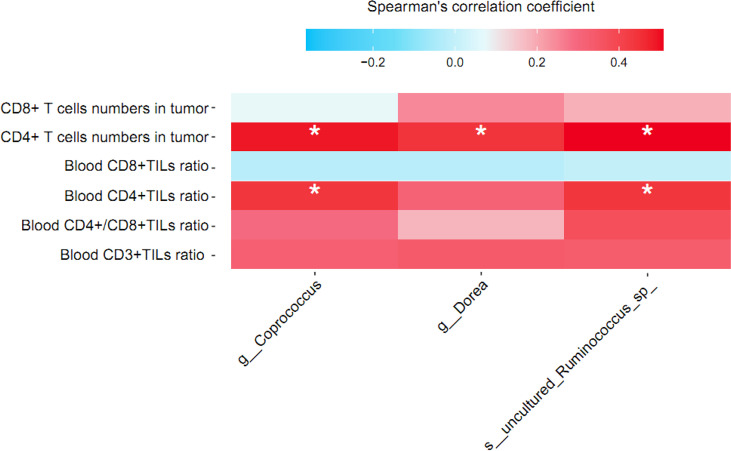
Figure 6.
Correlation between relative abundance of signature gut microbiota and T lymphocyte cell subsets in breast cancer patients treated by NAC. Partial Spearman’s rank correlation coefficient is indicated using a color gradient: red indicates positive correlation; blue, negative correlation. TIL, tumor infiltrating lymphocyte. * denotes p < 0.05.

