Figure 1.
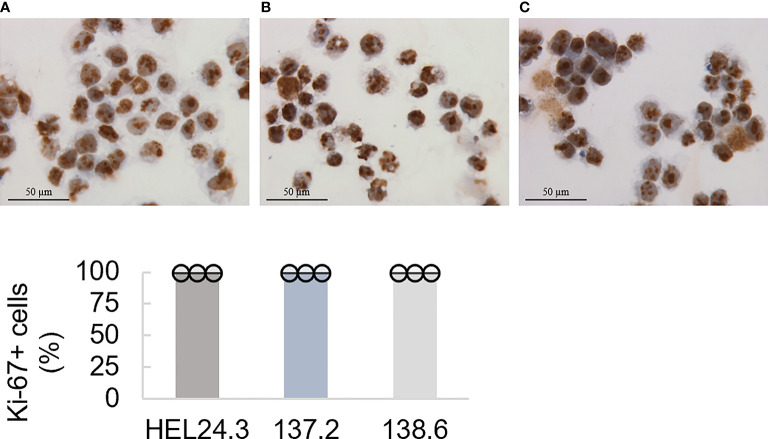
Proliferation capacity of APECED patient-derived iPSCs. Top panel: The healthy control iPSCs HEL24.3 (A) and APECED iPSCs 137.2 (B) and 138.6 (C) display similar Ki-67 positivity. Bottom graph: Quantitation of proliferation (Ki-67+) in the iPSCs reveals they are similar irrespective of AIRE mutation. Dots represent three individually performed replicates, with error bars representing SD within a replicate. Bar graphs are the mean of three replicates, with error bars representing SEM of the replicates. No difference was observed between the cell lines.

