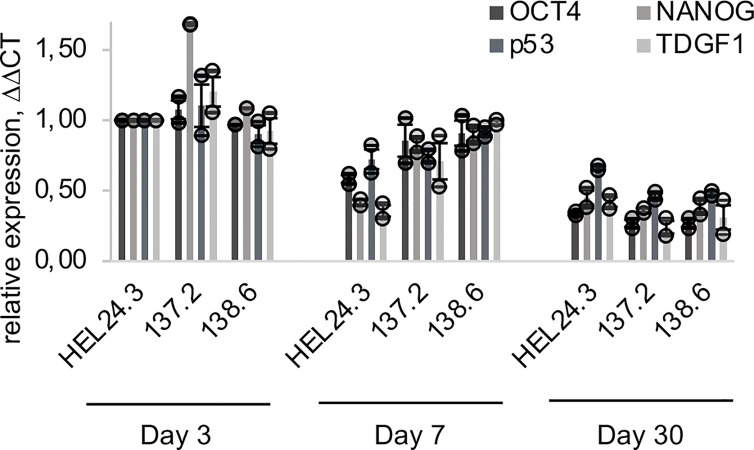
Figure 5.
qPCR quantification of OCT4, NANOG, p53 and TDGF1 expression in APECED and healthy person iPS-derived EBs. The relative mRNA expression in APECED EBs (137.2 and 138.6) and a healthy control (HEL24.3) EBs presented as a mean of ΔΔCt fold change of 2 independently analyzed biological replicates (shown as circles), normalized to the healthy control HEL24.3 day 3 sample. Error bars of the circles represent SD within a replicate. Error bars of the bars represent SEM of the two replicates.

