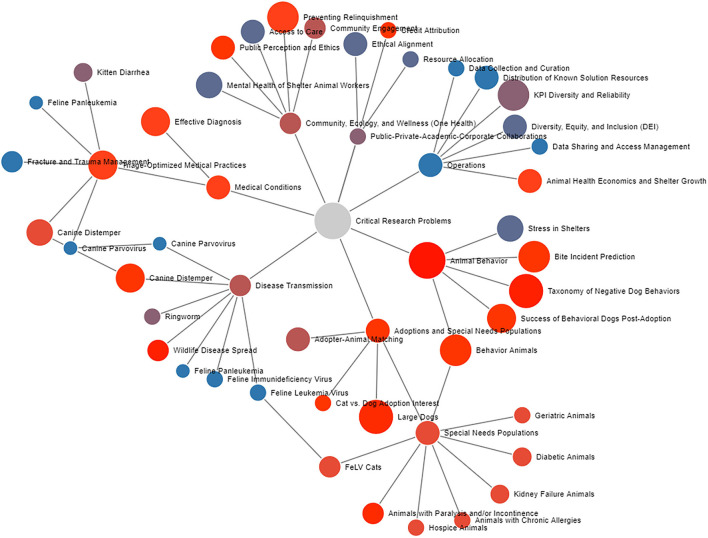
Figure 1.
A Force Directed Graph showing the various problems discussed in this article. The size of a node represents the relative impact a solution would have. The color represents the relative difficulty of studying the problem (with red being more difficult). Links relate the topics. An interactive version can be found here: https://codepen.io/kevroy314/pen/jONoXma. Click to isolate nodes and their neighbors. Drag to move around. Scroll to zoom.

