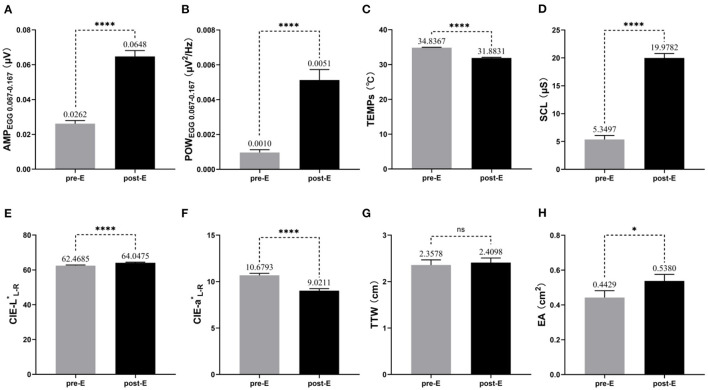
Figure 2.
Changes in objective indicators before and after exposure to MS (n = 51). The mean and standard error of measured values for each objective indicator during the pre-E and post-E periods are also labeled in the pictures. (A) AMPEGG0.067−0.167; (B) POWEGG0.067−0.167; (C) TEMPs; (D) SCL; (E) CIE-L*L−R; (F) CIE-a*L−R; (G) TTW; (H) EA. * p < 0.05; ****p < 0.0001; ns, no significance.

