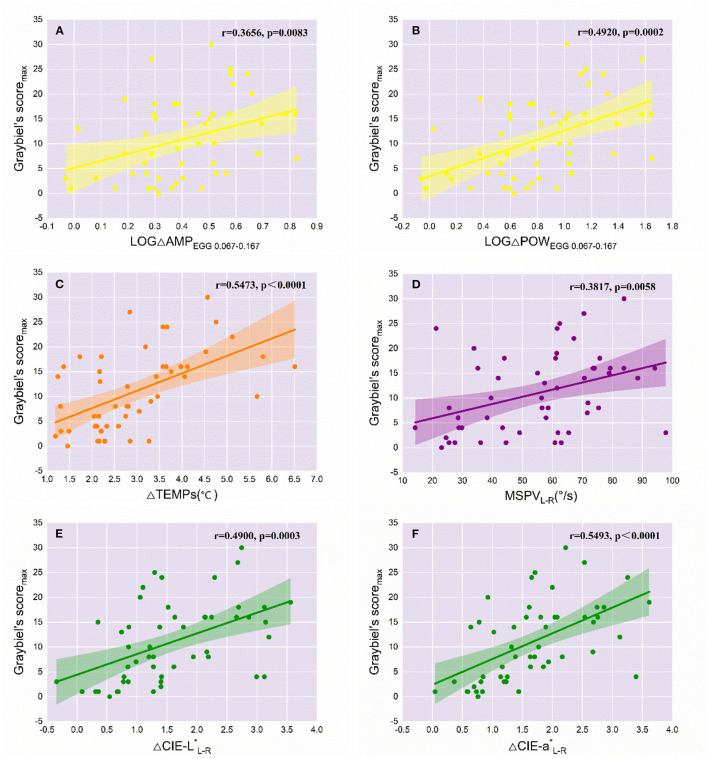
Figure 3.
Correlations of the variations of objective indicators with the severity of MS (n = 51). The r and p values of the objective variables significantly correlated with Graybiel's scoremax are labeled in each graph. The colored line represents the line of best fit for each linear regression, while the shaded area indicates the 95% confidence interval. (A) LOGΔAMPEGG0.067−0.167; (B) LOGΔPOWEGG0.067−0.167; (C) ΔTEMPs; (D) MSPVL−R; (E) ΔCIE-L*L−R; (F) ΔCIE-a*L−R.

