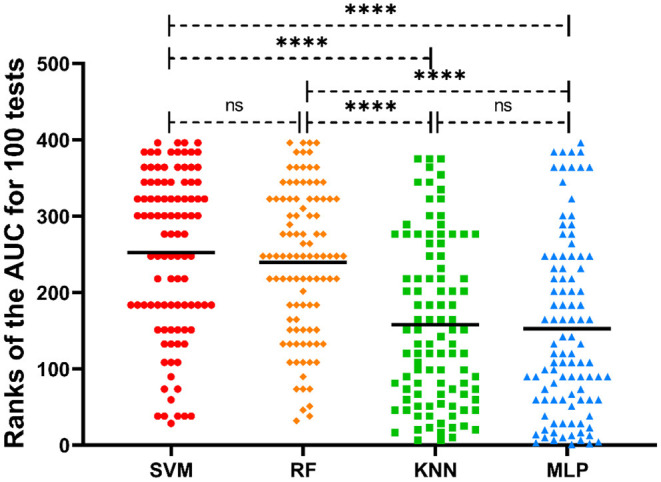
Figure 4.

Distribution of the ranks of AUC values of different ML classifiers for 100 tests. The mean ranks of the AUC values for each model are also labeled in the picture. ****p < 0.0001; ns, no significance.

Distribution of the ranks of AUC values of different ML classifiers for 100 tests. The mean ranks of the AUC values for each model are also labeled in the picture. ****p < 0.0001; ns, no significance.