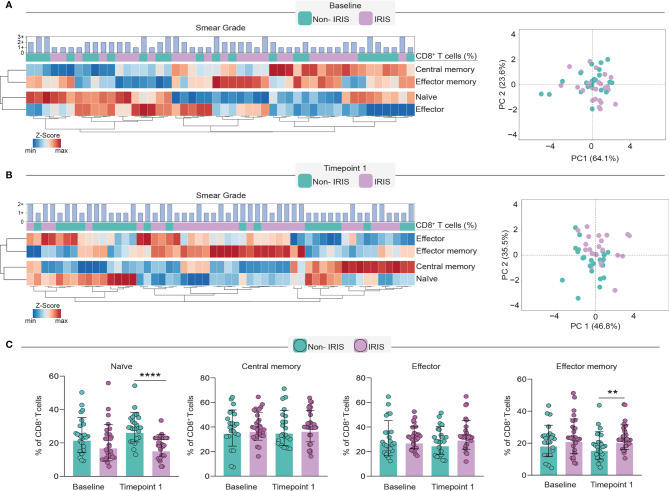
Figure 2.
Evaluation of CD8+ T cell memory subsets in TB-IRIS pathogenesis. In order to dissect the memory subset of CD8+ T cells, we employed a heatmap coupled with hierarchical cluster analysis (Ward’s method) and principal component analysis at baseline (A) and timepoint 1 (B). Principal component analysis was performed considering the frequencies of CD8+ T cell memory subsets at the aforementioned time points. Scatterplots depict the frequencies of each memory subset within total CD8+ T cell counts. (C) Comparison of frequencies of memory subsets in TB-IRIS and Non-IRIS patients. Data were analyzed using the Mann-Whitney test or Wilcoxon matched-pairs test for paired analyses within each study group (**p < 0.01, ****p < 0.0001).

