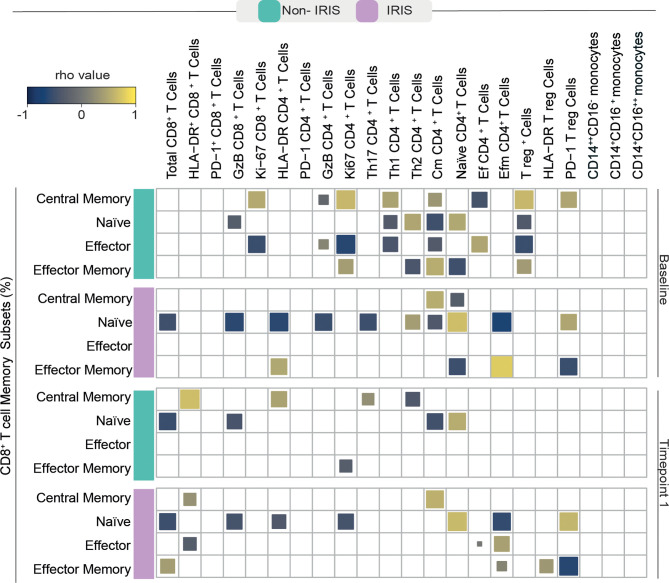
Figure 3.
Spearman correlations between CD8+ T cell memory subsets and activated adaptive and innate immune cells. A Spearman-based correlation matrix was employed to depict the strength of association among percentages of the memory subsets of CD8+ T cells and the frequency of other activated immune cells at Baseline (before ART) and after approximately 2 to 6 weeks following ART initiation (timepoint 1) for Non-IRIS and TB-IRIS subjects. Statistically significant correlations (P < 0.05) after adjustment for multiple measurements are highlighted as yellow squares (positive correlations) or blue squares (negative correlations).

