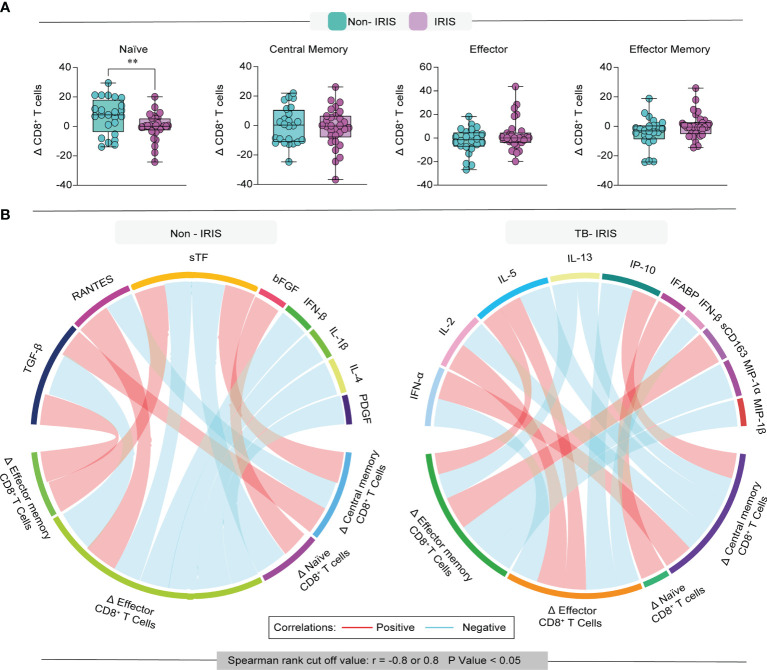
Figure 4.
Evaluation of the degree of immune reconstitution in memory CD8+ T cells. (A) Boxplot depicts the delta (frequency timepoint 1 – frequency baseline) of each memory subset in our study population. (B) Network analysis of CD8 T cell memory subsets and association with inflammation-related molecules; correlation matrices were developed with bootstrap (100 ×). Networks depicting only significant correlations (p < 0.05). Data were analyzed using the T-test (**p < 0.01).

