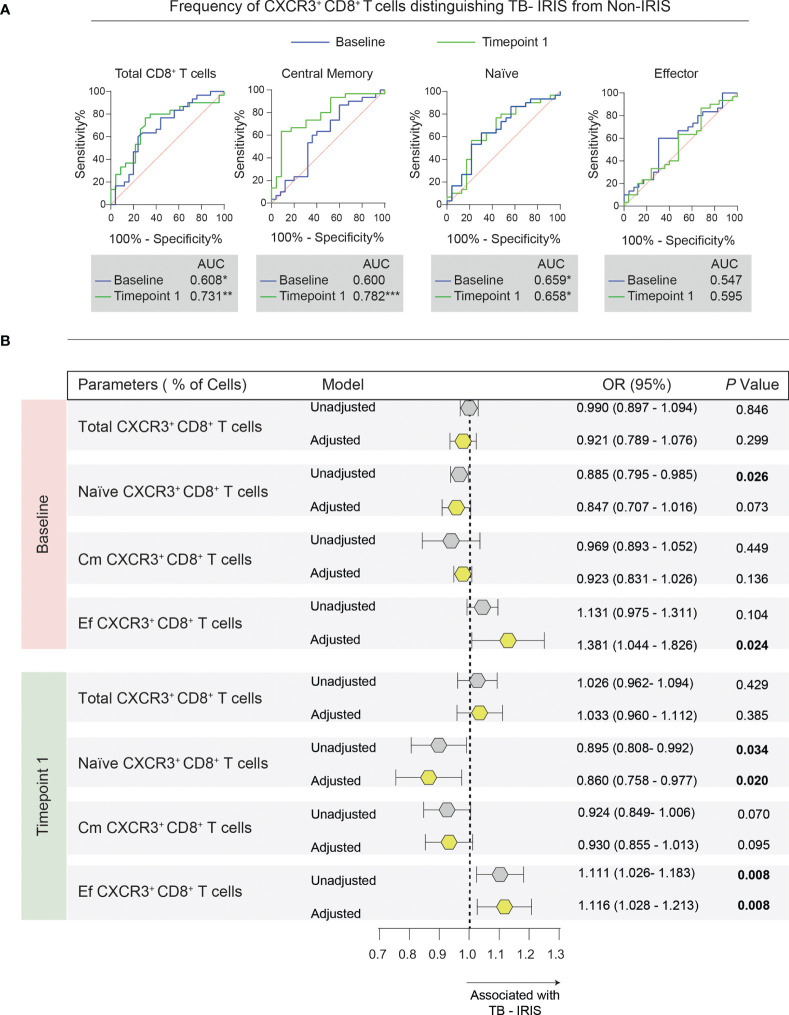
Figure 6.
Association between memory CD8+ T cell subsets expressing CXCR3 and the risk of TB-IRIS development. (A) Receiver operator characteristic (ROC) curves were employed to discriminate TB-IRIS from Non-IRIS patients at both timepoints taking into account the frequency of each flow cytometric population. (B) Multivariate regression analysis to evaluate the association between the frequencies of CXCR3+ memory CD8+ T cells and Mycobacterium tuberculosis immune reconstitution inflammatory syndrome (TB-IRIS). The multivariate model included the following variables: CD4+ T cell counts, viral load, smear grade, and the number of days between ATT and ART initiation. Odds ratios (OR) represent the 95% confidence interval increase in the frequency of each lymphocyte population. P values are shown in bold. Gray polygons represent unadjusted models, while yellow ones represent adjusted models.

