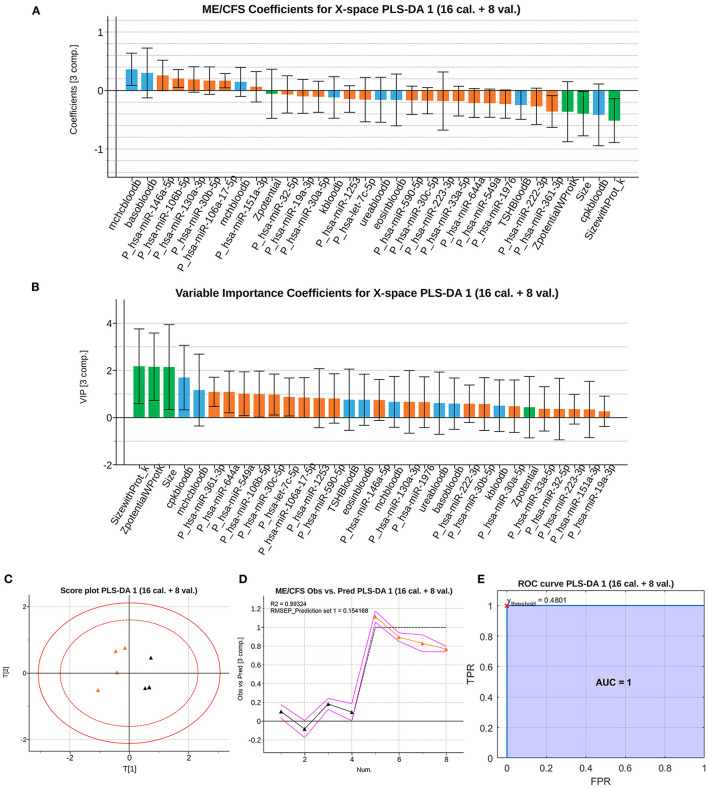
Figure 2.
Classification performance of the PLS-DA model with calibration and validation set. (A) ME/CFS class b jackknife coefficients for the X subspace using the calibration dataset. The color code corresponds the block to which each variable belongs, being those analytical variables (blue), PBMCs' miRNAs (orange) and EVs' characteristics (green). Jackknife confidence intervals were calculated at a 95% confidence level. (B) VIP coefficients with jackknife confidence intervals at 95% of confidence for the X subspace using the calibration dataset. Data set legends can be consulted on Supplementary Table 1. The color code for each variable block is the same as in the rest of the figures. (C) Score plot, of the 1st and 2nd components (horizontal and vertical, respectively) for the validation samples. (D) Observed vs. Prediction results for the validation samples shows the class prediction with 95% confidence intervals (magenta lines) using three components. The color code is orange for ME/CFS patients, and black markers for Healthy Controls (HCs). RMSEE stands for Root Mean Square Error of Estimation. (E) ROC curve for the classification of the validation observations with the trained dataset. The red cross locates the optimal performance point (maximum specificity and sensitivity) using the classification threshold at 0.4801.

