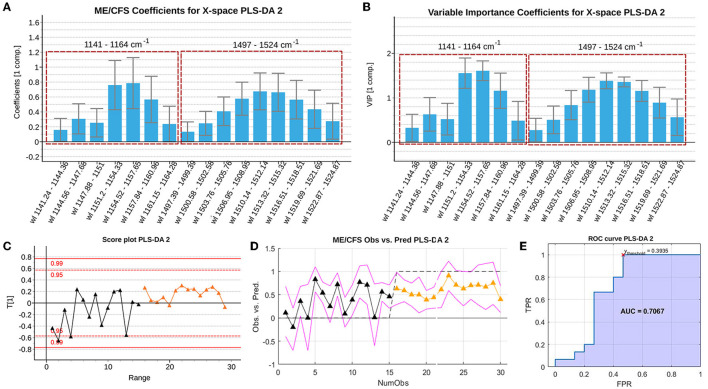
Figure 4.
Summary of the b PLS coefficients (A), the VIP coefficients (B), the scores (C), the observed vs. predicted values (RMSEE stands for Root Mean Square Error of Estimation). (D) and ROC curve (E) of the depurated PLS-DA model with the Raman spectroscopy data. The red cross locates the optimal performance point (maximum specificity and sensitivity) using the classification threshold at 0.3935. Data set legends can be consulted on Supplementary Table 1. Black triangles represent healthy controls, whereas orange triangles represent ME/CFS cases.

