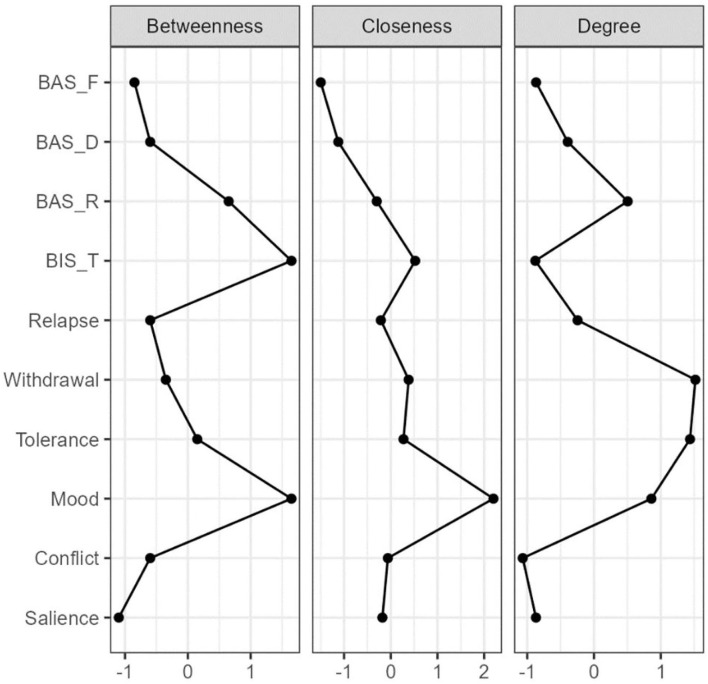
Figure 2.
Centrality Plots for EBICglaaso network depicting the betweenness, closeness, and degree (strength), expected influence of each node (variable). BIS-T, Behavioral inhibition systems; BAS-R, Behavioral activation systems-reward responsiveness; BAS-D, Behavioral activation systems-drive for goal; BAS-F, Behavioral activation systems-fun seeking.

