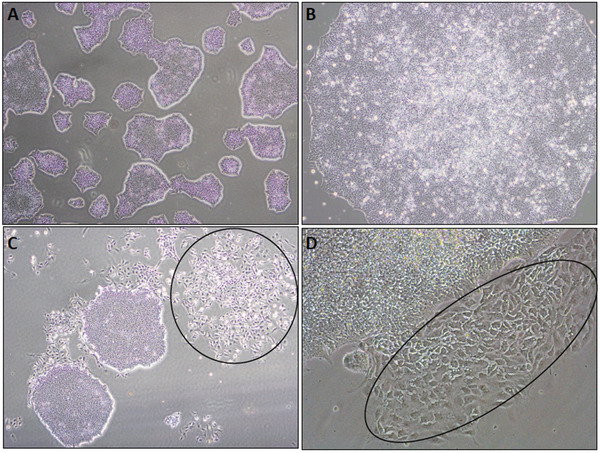
Figure 2.

Phase‐contrast images showing morphology of human iPSC colonies. (A) Density at which iPSC colonies are passaged (approximately 60% colony density). (B) Higher magnification of a normal iPSC colony. Note the smooth edge of the colony and the high nuclear‐to‐cytoplasmic ratio. Both characteristics are signs of an undifferentiated healthy iPSC colony. (C,D) Normal iPSC colonies surrounded by scattered spontaneously differentiating cells (circles).
