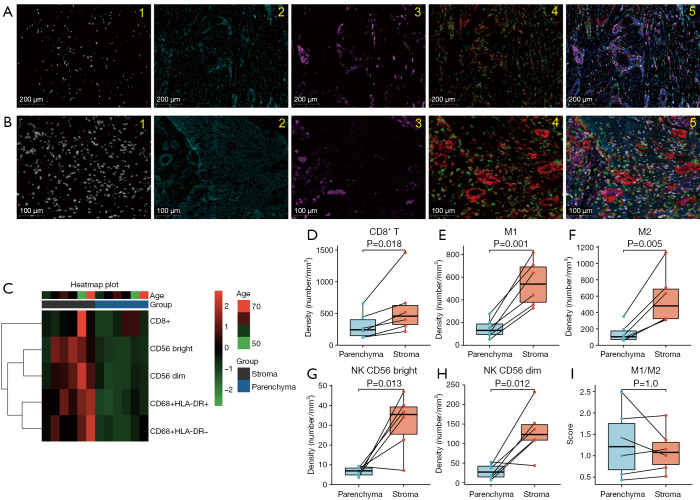
Figure 1.
Different tumor immune cell infiltration status in HNSCC patients. (A,B) Typical high-resolution images of mIHC from two random samples. Different colours represent different immune cell subpopulations. white, CD8; cyan, PanCK; purple, CD56; green, CD68; red, HLA-DR. (C) Heatmap of the infiltration of immune cells in the parenchyma and stroma. (D-I) The box diagram shows the infiltration of different immune cell subtypes in the parenchyma and stroma. HNSCC, head and neck squamous cell carcinoma; mIHC, multiplexed immunohistochemistry; M, macrophage; NK cell, natural killer cells.

