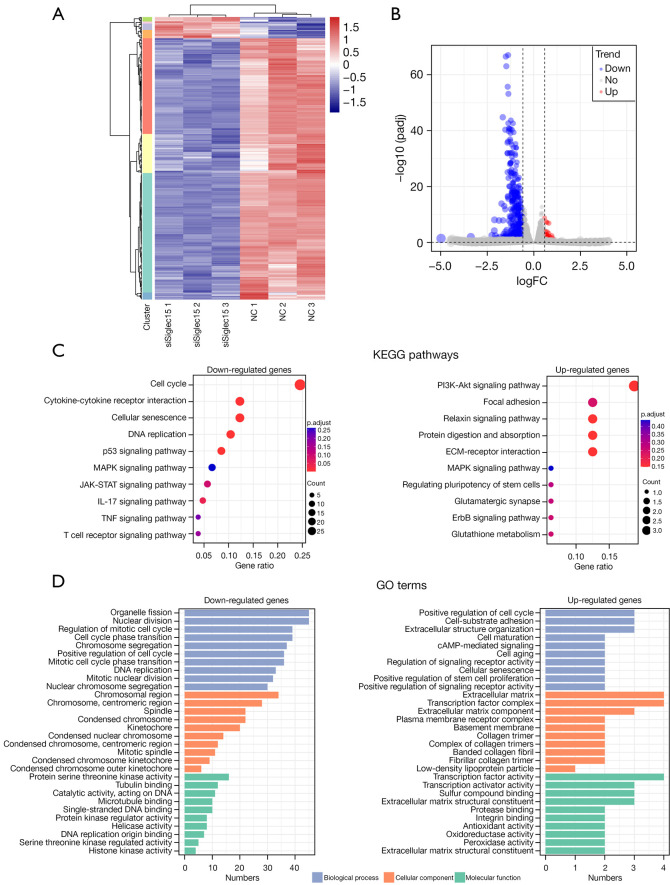
Figure 7.
mRNA expression profile changes in Siglec15-mediated immunosuppression effect of tumor cells on immune cells and function enrichment. (A) Heat map mRNA transcripts showing hierarchical clustering of altered mRNA transcripts in the siSiglec15 group vs. NC group. Red represents the up-regulated genes, while blue represents the down-regulated genes. (B) Volcano plot indicating up-and down-regulated mRNA transcripts in the siSiglec15 group vs. NC group. (C) KEGG pathway enrichment analysis of DEGs. The size of the point indicates the number of DEGs enriched in the pathway and the different colors represent the significance level of the enrichment result. (D) GO enrichment analysis of DEGs. The x-axis represents the number of DEGs and the y-axis represents the enriched GO terms. NC, normal control; KEGG, Kyoto Encyclopedia of Genes and Genomes; DEG, differentially-expressed genes; GO, Gene Ontology.

