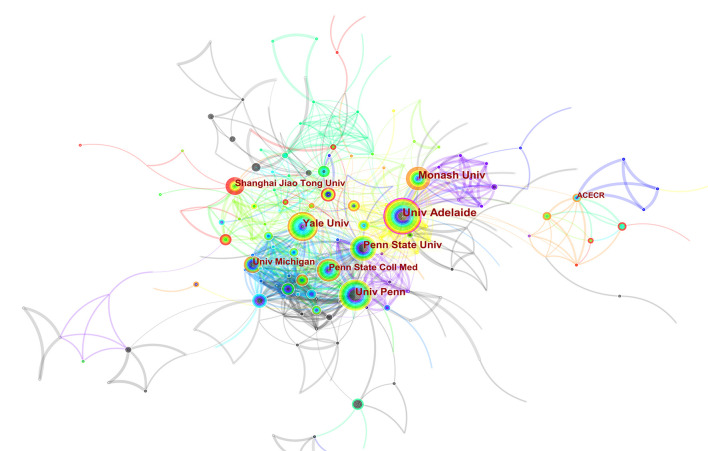
Figure 6.
Visualization map of the institution. There are 502 nodes (circles) in the figure, representing 502 institutions. The larger the circle, the more documents produced by that institution. A connection between 2 nodes means that 2 institutions appear in a document at the same time, that is, 2 institutions have a cooperative relationship in this document. There were 1,068 collaboration between these institutions.

