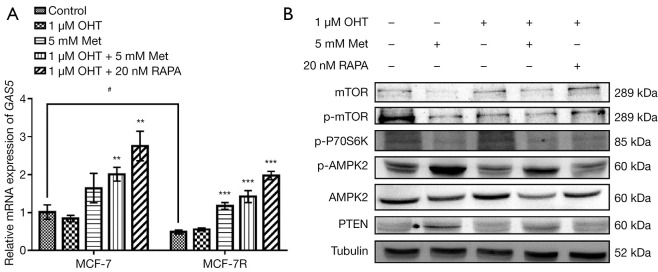
Figure 4.
Effect of metformin on lncRNA GAS5 and mTOR signaling pathway. (A) Quantitative real-time PCR was applied for appraising the mRNA expression of lncRNA GAS5 in MCF-7 and MCF-7R cells under different drug treatments [5 mM metformin (Met), 1µM 4-hydroxytamoxifen (OHT) and 20 nM rapamycin (RAPA)] for 48 h. (B) Western blot was used to evaluate the mTOR signaling-related proteins’ expression levels in MCF-7R cells after different drug treatments. **, P<0.01; ***, P<0.001 compared with control (without any processing); #, P<0.05 compared with MCF-7 cells. Outcomes are given as mean ± SD of three independent assessments (n≥3). “+” indicated that the substance has been added; “−” indicated that the substance was not added.

