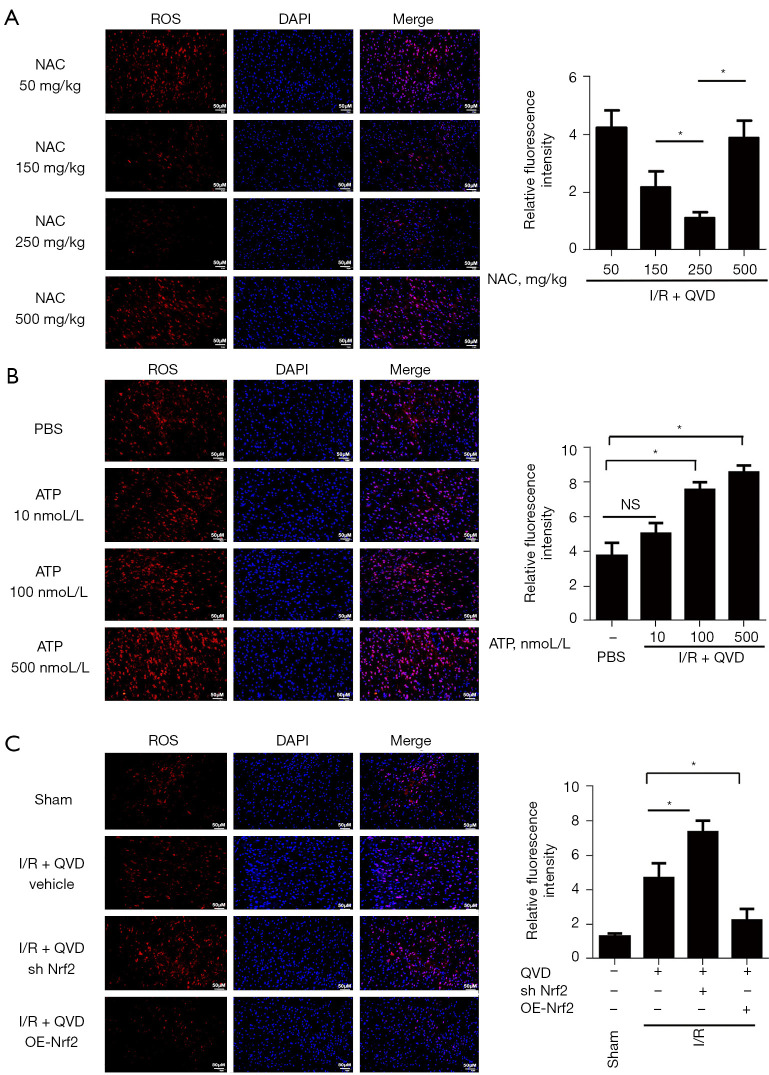
Figure 3.
ROS level in brain tissue slides was assessed by DHE staining. (A) Fluorescence micrographs of the brain slice with increasing dose (mg/kg) of NAC, at 20× magnification. Scale bar represents 50 µm; (B) fluorescence micrographs of the brain slice with increasing concentrations (nmol/L) of ATP, with a magnification of 20 was used. Scale bar: 50 mm; (C) the regulation of Nrf2 on the level of ROS. Fluorescence micrographs of the brain slice in sham group, I/R + QVD + vehicle, I/R + QVD + sh Nrf2, and I/R + QVD + OE-Nrf2 groups, at 20× magnification. Scale bar represents 50 µm. Images were taken under identical conditions and exposures; N=4 for each group. NS, no significant difference; *P<0.05. ROS, reactive oxygen species; DHE, dihydroethidium; NAC, N-acetylcysteine; ATP, adenosine triphosphate; I/R, ischemia-reperfusion; Nrf2, nuclear factor E2-related factor-2.

